Data &
Technology
Research
Reports
Report Solutions
Reports Library
Actionable
Strategies
Free
Resources
Simple Backtest Calculator
Simple Seasonality Calculator
The Kelly Criterion Calculator
Sentiment Geo Map
Public Research Reports
Free Webinar
Pricing
Company
About
Meet Our Team
In the News
Testimonials
Client Success Stories
Contact
Log inLoginSign up
< BACK TO ALL REPORTS

In record time, small stocks (almost) double

Jason Goepfert
2020-12-15
The small-cap Russell 2000 has almost doubled from its most recent 52-week low, in the fewest amount of days in the index's history.

Last week, some signs of "smart money" selling were triggering, yet options speculation was hitting records.

Choppy conditions over the past week didn't seem to dent that behavior at all. Among the smallest of traders, 54% of volume flowed into buying call options to open. That's a record amount of focus among the most speculative of strategies and among the most speculative of traders.

It's hard to blame folks for getting so positive. After being left behind, smaller stocks have surged in recent months, and that contributed to impressive, even historic, positive breadth readings. About the only cautionary signal is just how stretched prices have become. At its high on Monday, the Russell 2000 almost doubled from its most recent 52-week low.

russell 2000 double from 52 week low

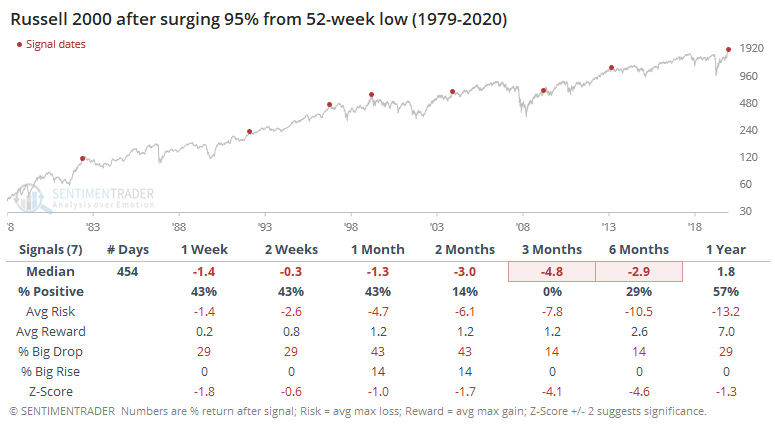
Even a surge of 95% off a low has preceded losses in the small-cap index over the next 3 months every time.


What else is happening

These are topics we explored in our most recent research. For immediate access with no obligation, sign up for a 30-day free trial now.

  • Full returns after the Russell 2000 almost doubles from a low
  • What that meant for the S&P 500
  • Looking at a near-double in small-cap stocks from a low since 1926
  • Dumb Money Confidence is rolling over from a record high
  • The Optimism Index on the U.S. dollar is curling higher from extreme pessimism
  • The McClellan Oscillators for the DAX and Shanghai Composite are oversold

Stat Box

Among S&P 500 stocks, 11 of them suffered a "buying climax" on Monday. A climax is triggered when a stock hits a 52-week high and then closes lower than where it closed the previous day. This is the 10th-highest reading in the past 6 months.

Sentiment from other perspectives

We don't necessarily agree with everything posted here - some of our work might directly contradict it - but it's often worth knowing what others are watching.

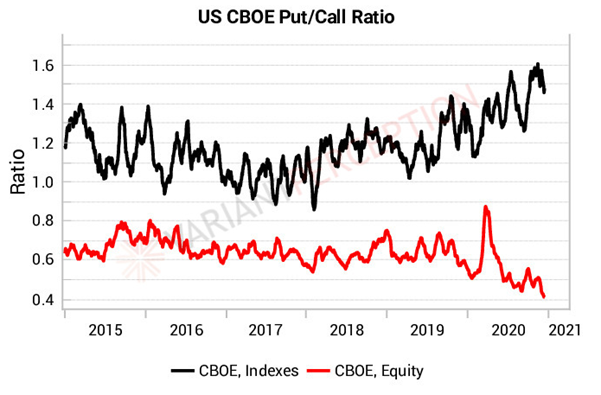
1. Putting some color on the extremes in put/call ratios, it's not just that traders are turning over a massive amount of calls relative to puts on equities, they're doing the exact opposite in indexes. Buying calls on stocks and hedging with puts on the index? [Variant Perception]

equity index put call ratio

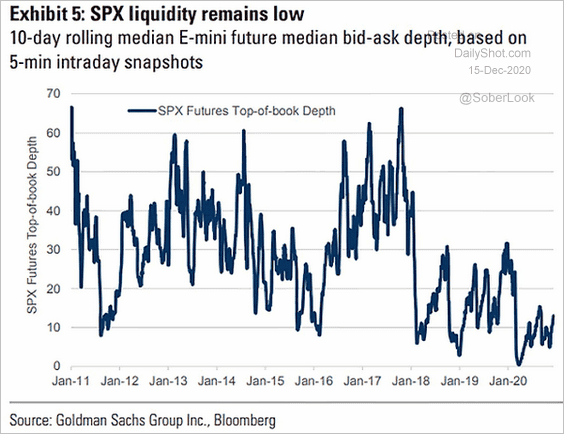
2. At least those options traders might be getting good prices because of a deep market. If they were trading the futures instead, then they might not be quite so fortunate, as liquidity in the biggest futures market of them all remains near historic lows. [Bloomberg]

s&p e mini futures liquidity

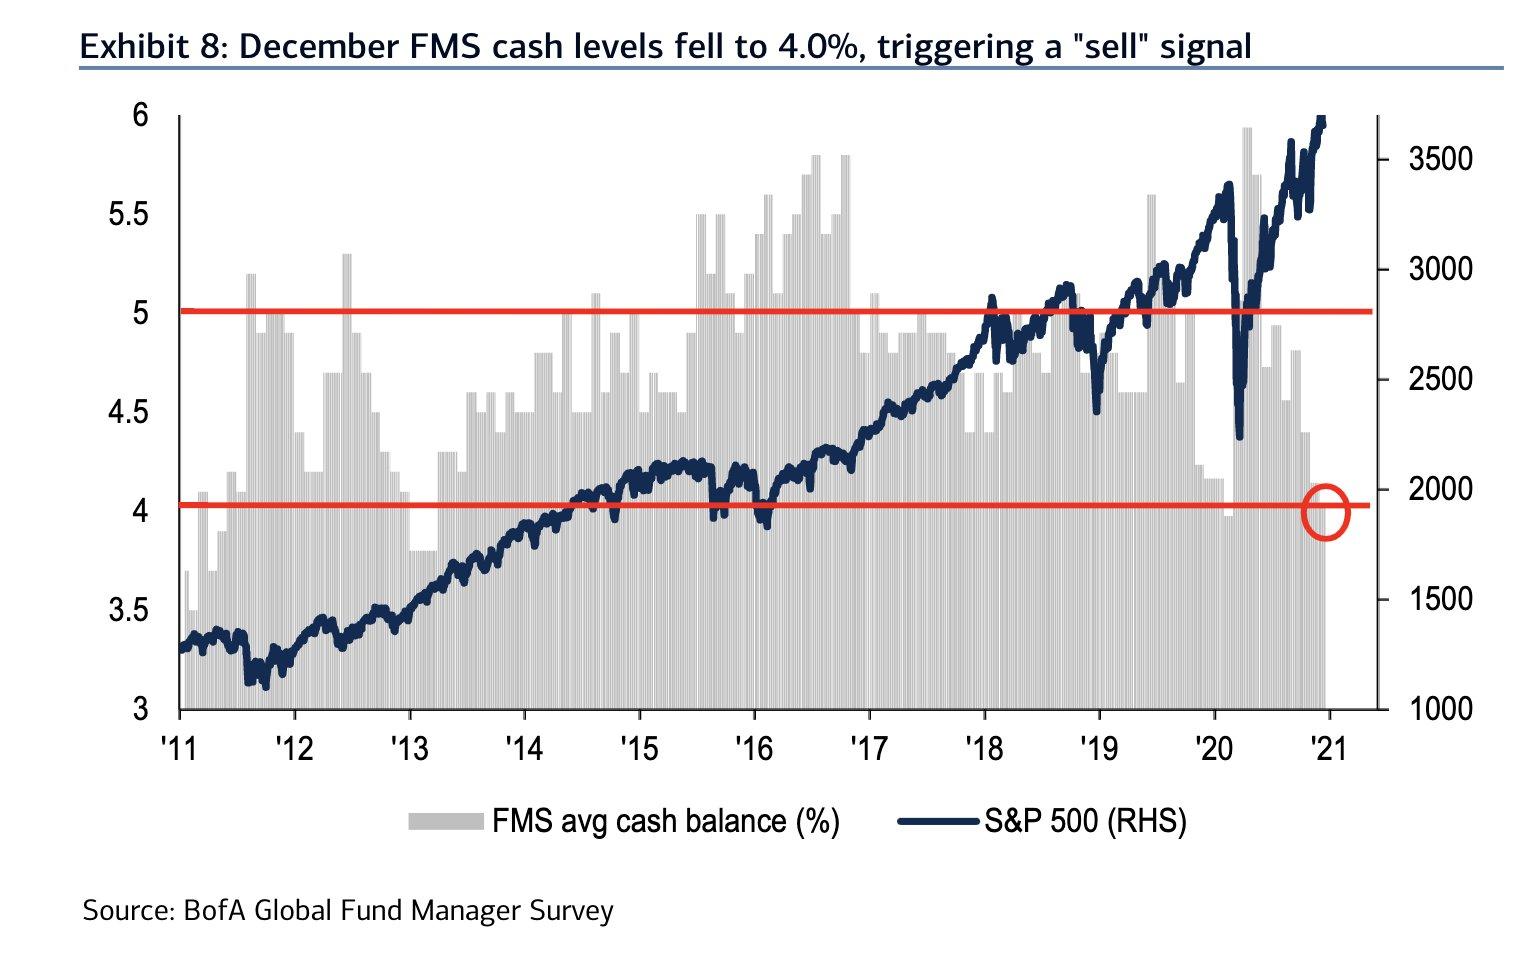
3. Fund managers seem to be in the camp of not wanting to look silly by being under-invested ahead of year-end. Cash levels among them have plunged by 40%, triggering a sell signal according to a BofA research model. [BofA]

bofa fund manager survey

DATA &
TECHnologies
IndicatorEdge
‍
BackTestEdge
‍
Other Tools
‍
DataEdge API
RESEARCH
reports
Research Solution
‍
Reports Library
‍
actionable
Strategies
Trading Strategies
‍
Smart Stock Scanner
‍
FREE
RESOUrCES
Simple Backtest
Calculator
Simple Seasonality
Calculator
The Kelly Criterion
Calculator
Sentiment Geo Map
‍
Public Research Reports
‍
Free Webinar
COMPANY
‍
About
‍
Meet our Team
‍
In the News
‍
Testimonials
‍
Client Success Stories
Pricing
Bundle pricing
‍
Announcements
‍
FAQ
© 2024 Sundial Capital Research Inc. All rights reserved.
Setsail Marketing
TermsPrivacyAffiliate Program
Risk Disclosure: Futures and forex trading contains substantial risk and is not for every investor. An investor could potentially lose all or more than the initial investment. Risk capital is money that can be lost without jeopardizing ones’ financial security or life style. Only risk capital should be used for trading and only those with sufficient risk capital should consider trading. Past performance is not necessarily indicative of future results.

Hypothetical Performance Disclosure: Hypothetical performance results have many inherent limitations, some of which are described below. No representation is being made that any account will or is likely to achieve profits or losses similar to those shown; in fact, there are frequently sharp differences between hypothetical performance results and the actual results subsequently achieved by any particular trading program. One of the limitations of hypothetical performance results is that they are generally prepared with the benefit of hindsight. In addition, hypothetical trading does not involve financial risk, and no hypothetical trading record can completely account for the impact of financial risk of actual trading. for example, the ability to withstand losses or to adhere to a particular trading program in spite of trading losses are material points which can also adversely affect actual trading results. There are numerous other factors related to the markets in general or to the implementation of any specific trading program which cannot be fully accounted for in the preparation of hypothetical performance results and all which can adversely affect trading results.

Testimonial Disclosure: Testimonials appearing on this website may not be representative of other clients or customers and is not a guarantee of future performance or success.