Data &
Technology
Research
Reports
Report Solutions
Reports Library
Actionable
Strategies
Free
Resources
Simple Backtest Calculator
Simple Seasonality Calculator
The Kelly Criterion Calculator
Sentiment Geo Map
Public Research Reports
Free Webinar
Pricing
Company
About
Meet Our Team
In the News
Testimonials
Client Success Stories
Contact
Log inLoginSign up
< BACK TO ALL REPORTS

In June, Some Sectors Have It, And Some Don't

Jason Goepfert
2021-06-01
In June, there are 4 sectors that consistently outperform another 4.

There are no "sure things" in the financial markets. But there sure are "things." Two of those "things" are:

  1. Except for the Nasdaq Index (for whatever reason), the month of June is often (though not always) unkind to the stock market.
  2. Specific sectors have shown a definite tendency to outperform during the sixth month of the year, while others have shown a definite tendency to underperform.

So, let's take a closer look at sector investing in June using the 11 S&P 500 Sector Indexes starting in 1950.

We will test the top and bottom sectors as follows:

  • Each June, we divide one portfolio by four and allocate 25% to each of the Top 4 sectors
  • Each June, we divide another portfolio by four and allocate 25% to each of the Bottom 4 sectors

The top sectors include defensive sectors like Health Care, while the bottom ones are more aggressive sectors like Technology.

The chart below divides the growth of the Top 4 by the growth of the Bottom 4.  When the line is rising, it means the Top 4 sectors are outperforming and vice versa.

Top 4 versus bottom 4 sectors for June

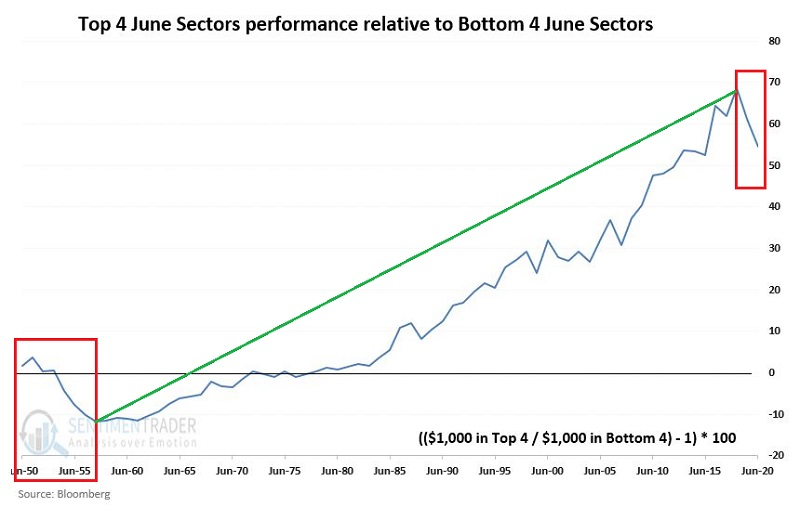
The Top 4 underperformed during the first seven years and last two years of the 1950-2020 test period. However, the Top 4 consistently outperformed the Bottom 4 for the intervening 61 years. So as we head into what can be a challenging month, it's worth noting that at least there are some sectors that aren't challenged quite as often.

Stat Box

Big test for gold miners. The percentage of mining stocks with a rising 200-day average has started to curl higher from a very low level. Our Backtest Engine shows this has happened 18 other times in the past 30 years, and one month later the NYSE Arca Gold Bugs Index was higher after 14 of them. But when it failed, it failed big.


What else we're looking at

  • Full details on the top and bottom sectors for June.
  • The ISM new orders to prices paid spread has plunged
  • What a negative spread has meant for the S&P 500, sectors, and factors
DATA &
TECHnologies
IndicatorEdge
‍
BackTestEdge
‍
Other Tools
‍
DataEdge API
RESEARCH
reports
Research Solution
‍
Reports Library
‍
actionable
Strategies
Trading Strategies
‍
Smart Stock Scanner
‍
FREE
RESOUrCES
Simple Backtest
Calculator
Simple Seasonality
Calculator
The Kelly Criterion
Calculator
Sentiment Geo Map
‍
Public Research Reports
‍
Free Webinar
COMPANY
‍
About
‍
Meet our Team
‍
In the News
‍
Testimonials
‍
Client Success Stories
Pricing
Bundle pricing
‍
Announcements
‍
FAQ
© 2024 Sundial Capital Research Inc. All rights reserved.
Setsail Marketing
TermsPrivacyAffiliate Program
Risk Disclosure: Futures and forex trading contains substantial risk and is not for every investor. An investor could potentially lose all or more than the initial investment. Risk capital is money that can be lost without jeopardizing ones’ financial security or life style. Only risk capital should be used for trading and only those with sufficient risk capital should consider trading. Past performance is not necessarily indicative of future results.

Hypothetical Performance Disclosure: Hypothetical performance results have many inherent limitations, some of which are described below. No representation is being made that any account will or is likely to achieve profits or losses similar to those shown; in fact, there are frequently sharp differences between hypothetical performance results and the actual results subsequently achieved by any particular trading program. One of the limitations of hypothetical performance results is that they are generally prepared with the benefit of hindsight. In addition, hypothetical trading does not involve financial risk, and no hypothetical trading record can completely account for the impact of financial risk of actual trading. for example, the ability to withstand losses or to adhere to a particular trading program in spite of trading losses are material points which can also adversely affect actual trading results. There are numerous other factors related to the markets in general or to the implementation of any specific trading program which cannot be fully accounted for in the preparation of hypothetical performance results and all which can adversely affect trading results.

Testimonial Disclosure: Testimonials appearing on this website may not be representative of other clients or customers and is not a guarantee of future performance or success.