Data &
Technology
Research
Reports
Report Solutions
Reports Library
Actionable
Strategies
Free
Resources
Simple Backtest Calculator
Simple Seasonality Calculator
The Kelly Criterion Calculator
Sentiment Geo Map
Public Research Reports
Free Webinar
Pricing
Company
About
Meet Our Team
In the News
Testimonials
Client Success Stories
Contact
Log inLoginSign up
< BACK TO ALL REPORTS

In a broad global recovery, China stands out

Jason Goepfert
2021-04-14
Trading activity in Chinese shares has dwindled as participation among stocks on the Shanghai has been poor. Behavior in breadth metrics is what we see during poor market environments. And sentiment toward Chinese large-cap stocks still isn't showing much pessimism.

Last week, we saw that there has been a remarkable thrust in breadth among global markets.

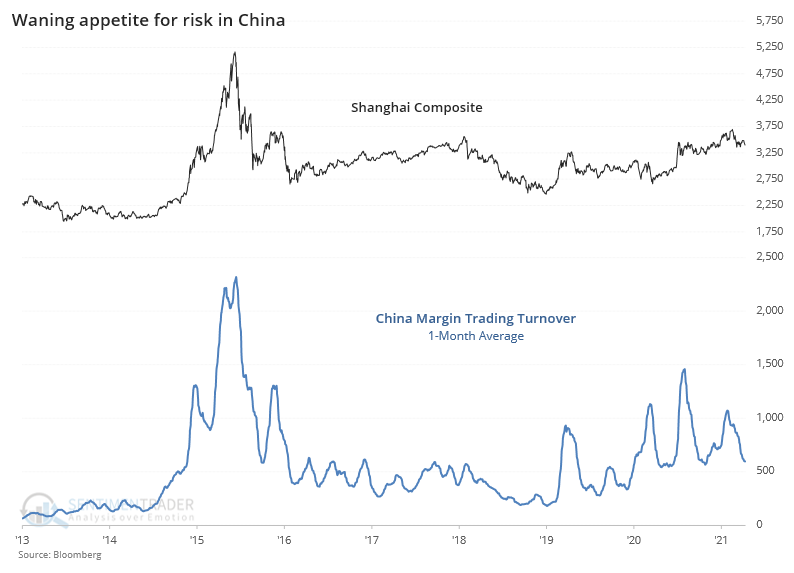
But not everyone is participating. Appetite for trading in China has wanted, as Bloomberg recently noted. The lack of enthusiasm is even more pronounced among those trading on margin. Turnover in margin accounts over the past month has sunk dramatically.

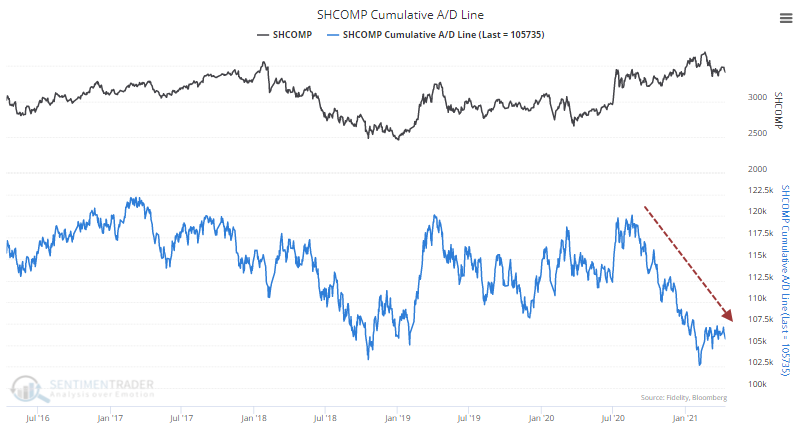
It's not hard to see why. The average stock in that market has been declining for months, even if some of the major Chinese indexes have held up despite that deterioration. The Cumulative Advance/Decline Line for the Shanghai Composite is challenging its 5-year low.

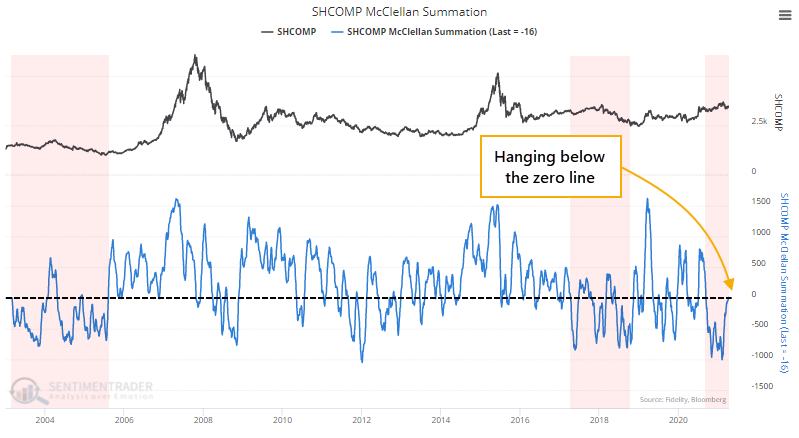
This activity has pushed the McClellan Summation Index for the Shanghai below zero...and kept it there. This is exactly the opposite of what we see in a healthy market environment.

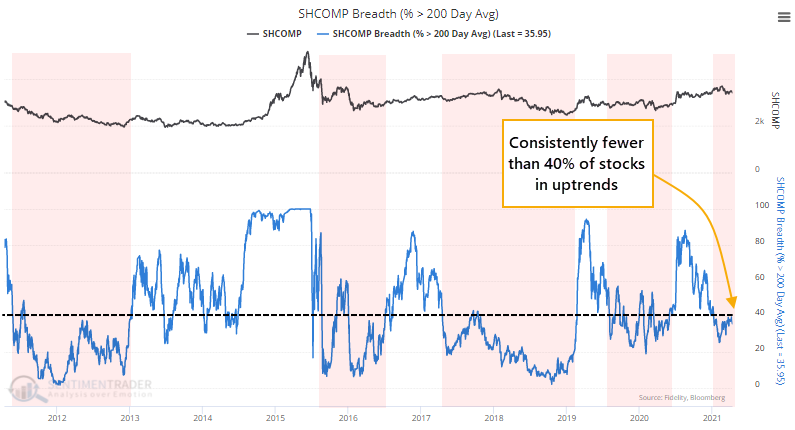
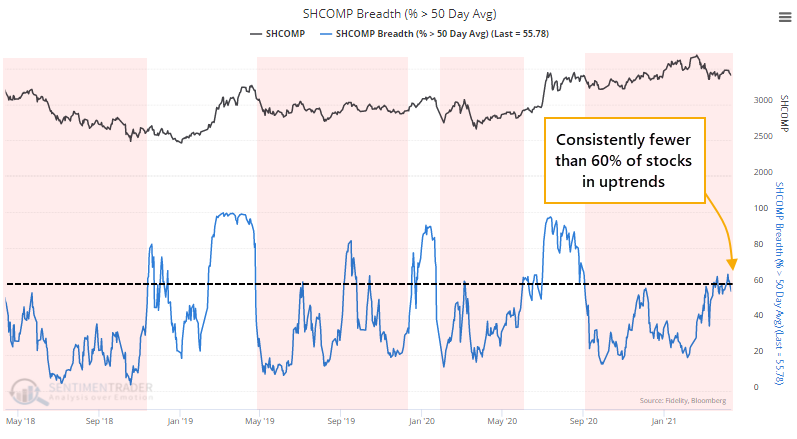
That's also evident in the percentage of those stocks holding above their 200-day moving averages. In a healthy market or sector, we typically see this figure hold above 60%, with forays below 40% bringing in interest among buyers. In an unhealthy market, this figure typically holds below 40%, with moves above 60% generating selling pressure.

We use the same general guidelines on a medium-term basis, with the percentage of stocks above their 50-day average. And that, too, shows unhealthy behavior, as fewer than 60% of stocks have been holding above their averages. That's not what we see during robust markets.

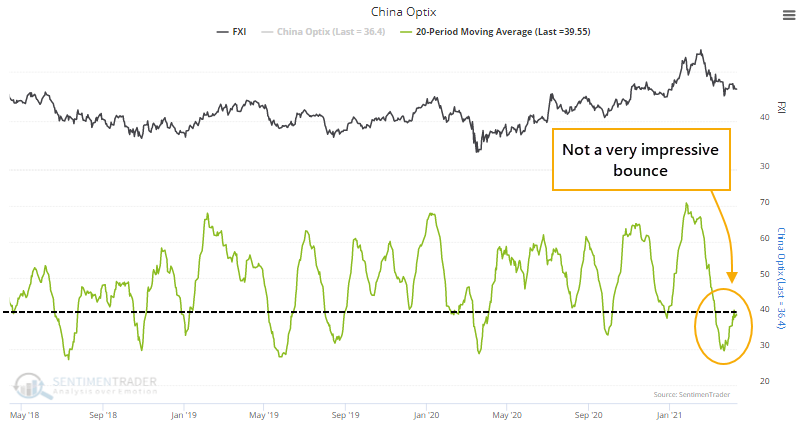
If we focus on larger-cap stocks in that market, represented by the FXI fund in the U.S., then it's a similar message. The Optimism Index plunged below 40 and has only grudgingly rebounded, with prices meandering.

In strong uptrends, when sentiment drops into pessimistic territory, there's usually more of a "spiky" rebound as buyers sense an opportunity.

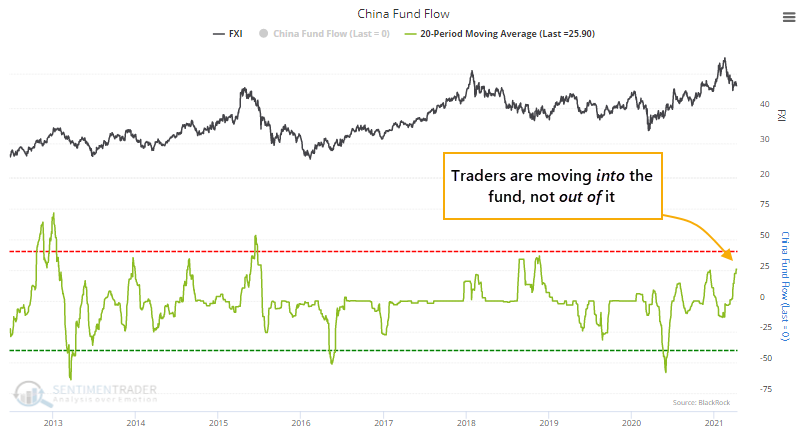
Other measures never really showed much pessimism anyway over the past month. Traders were still moving money into the fund, not out of it.

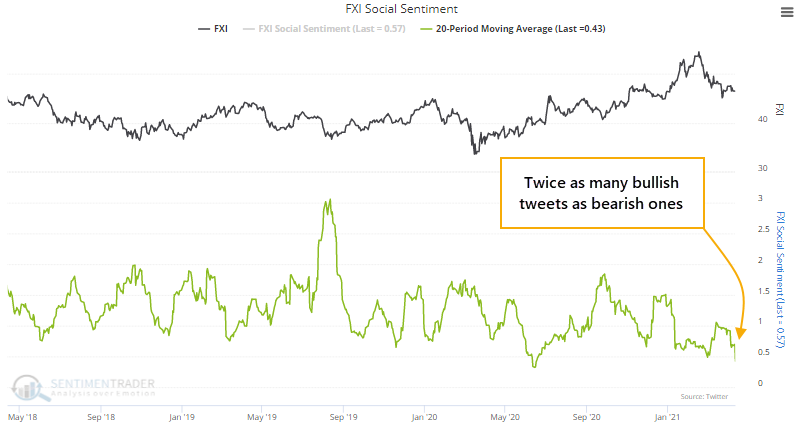
On social media, twitter users have tweeted twice as many bullish messages about the fund than bearish messages. This is calculated like a put/call ratio, so a low reading below 1.0 means that there are more bullish than bearish messages.

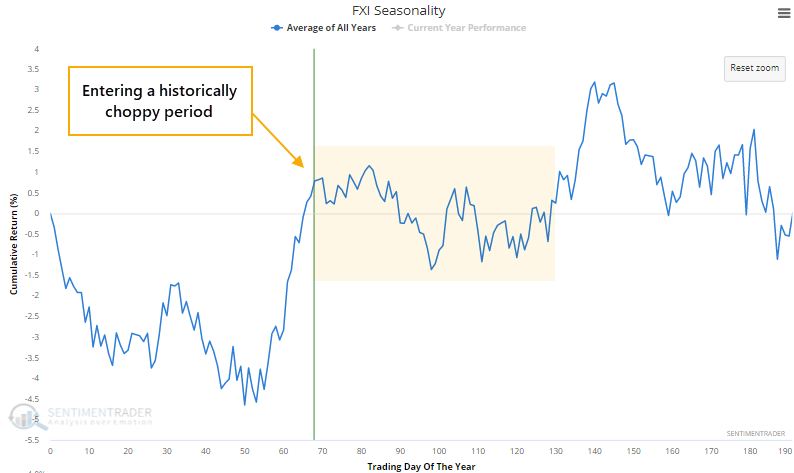
This is coming just as FXI is entering what has traditionally been a choppy seasonal window into the summer months.

None of this is especially damning evidence for buyers, but there isn't much here to suggest it's a great opportunity. Chinese stocks have been showing poor participation, and buyers have not been eager like they are in healthier market environments. Many stocks are lagging, and it's not like we're seeing overwhelming displays of pessimism that might hint at a contrarian opportunity.

This market needs to see much more of a give-up attitude among investors, or much better internal participation, before potential reward would seem to outweigh the risk.

Sorry, you don't have access to this report

Upgrade your subscription plan to get access
Go to Dasboard
DATA &
TECHnologies
IndicatorEdge
‍
BackTestEdge
‍
Other Tools
‍
DataEdge API
RESEARCH
reports
Research Solution
‍
Reports Library
‍
actionable
Strategies
Trading Strategies
‍
Smart Stock Scanner
‍
FREE
RESOUrCES
Simple Backtest
Calculator
Simple Seasonality
Calculator
The Kelly Criterion
Calculator
Sentiment Geo Map
‍
Public Research Reports
‍
Free Webinar
COMPANY
‍
About
‍
Meet our Team
‍
In the News
‍
Testimonials
‍
Client Success Stories
Pricing
Bundle pricing
‍
Announcements
‍
FAQ
© 2024 Sundial Capital Research Inc. All rights reserved.
Setsail Marketing
TermsPrivacyAffiliate Program
Risk Disclosure: Futures and forex trading contains substantial risk and is not for every investor. An investor could potentially lose all or more than the initial investment. Risk capital is money that can be lost without jeopardizing ones’ financial security or life style. Only risk capital should be used for trading and only those with sufficient risk capital should consider trading. Past performance is not necessarily indicative of future results.

Hypothetical Performance Disclosure: Hypothetical performance results have many inherent limitations, some of which are described below. No representation is being made that any account will or is likely to achieve profits or losses similar to those shown; in fact, there are frequently sharp differences between hypothetical performance results and the actual results subsequently achieved by any particular trading program. One of the limitations of hypothetical performance results is that they are generally prepared with the benefit of hindsight. In addition, hypothetical trading does not involve financial risk, and no hypothetical trading record can completely account for the impact of financial risk of actual trading. for example, the ability to withstand losses or to adhere to a particular trading program in spite of trading losses are material points which can also adversely affect actual trading results. There are numerous other factors related to the markets in general or to the implementation of any specific trading program which cannot be fully accounted for in the preparation of hypothetical performance results and all which can adversely affect trading results.

Testimonial Disclosure: Testimonials appearing on this website may not be representative of other clients or customers and is not a guarantee of future performance or success.