Data &
Technology
Research
Reports
Report Solutions
Reports Library
Actionable
Strategies
Free
Resources
Simple Backtest Calculator
Simple Seasonality Calculator
The Kelly Criterion Calculator
Sentiment Geo Map
Public Research Reports
Free Webinar
Pricing
Company
About
Meet Our Team
In the News
Testimonials
Client Success Stories
Contact
Log inLoginSign up
< BACK TO ALL REPORTS

Improving economic data

Troy Bombardia
2020-06-16
U.S. economic data is improving after months of historically awful readings.

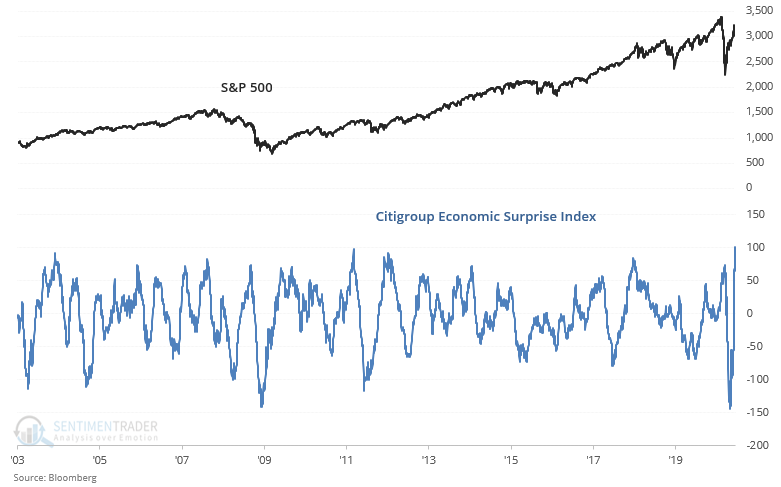
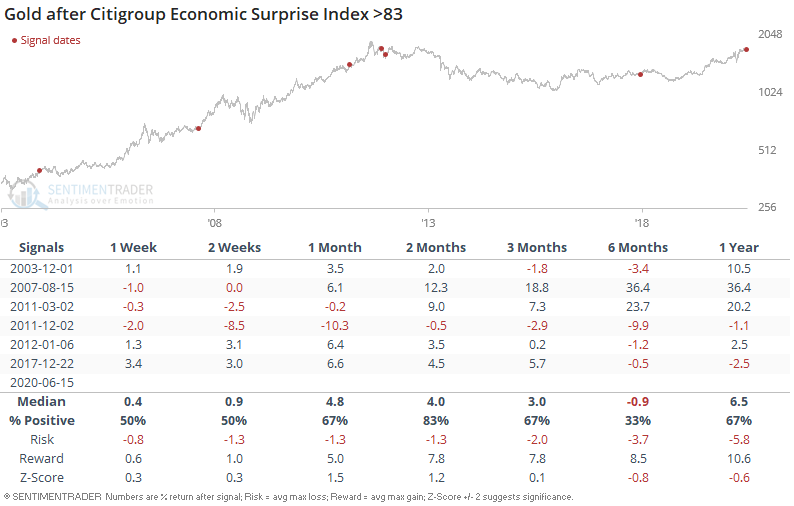
U.S. economic data is improving after months of historically awful readings. The Citigroup Economic Surprise Index, which tracks economic data relative to expectations, has hit an all-time high as the U.S. economy recovers.

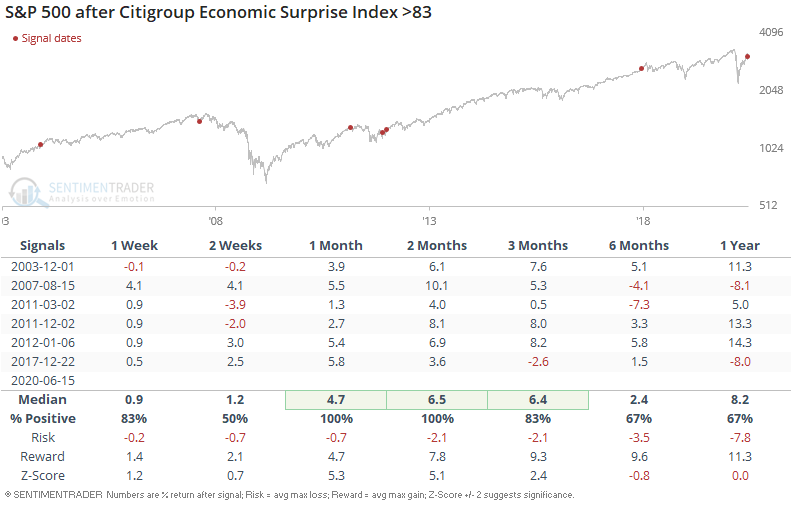
Less extreme readings were universally bullish for the S&P over the next 1-2 months:

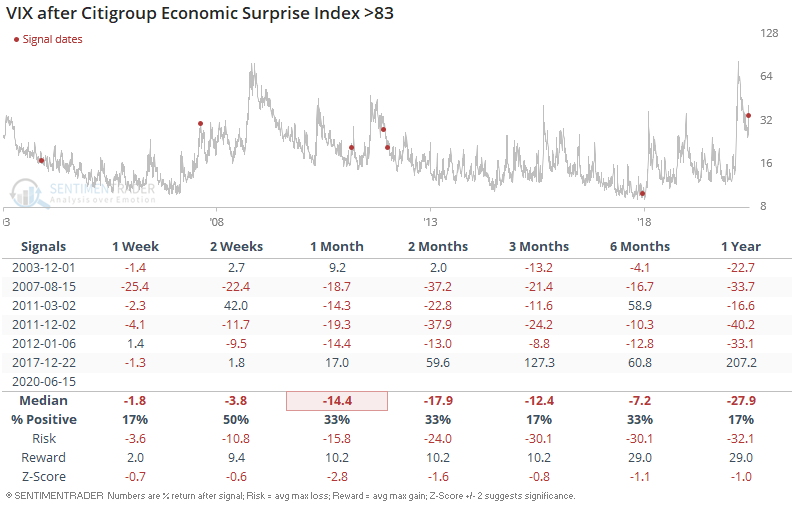
As a result, it was mostly bearish for VIX over the next 1-2 months. The single major exception was in December 2017, after a year of extremely low volatility and an incessant stock market rally. The market environment between December 2017 vs. today is clearly different:

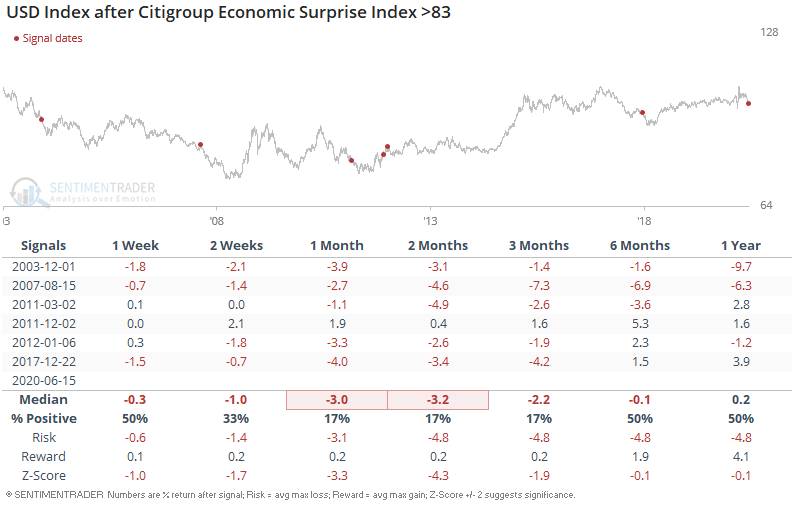
As for the U.S. Dollar Index, this was mostly bearish for the USD over the next 1-2 months:

And it was mostly bullish for gold over the next 2 months:

Recently there's been this narrative going around the internet that the bear market is over, and this is the start of a new bull market (i.e. today is just like 2009). I strongly disagree.

From a valuations perspective, today is NOTHING like 2009. Valuations may not matter on a 1 year, 2 year, or even 3 year basis, but it does matter on a 5-10 year basis. If valuations are sky-high, it is simply not possible to have a massive 10 year bull market. If valuations are high, it means that the stock market's earnings' yield is low, which implies that long term forward returns will be poor-mediocre. (Real estate investors will understand this intuitively. High valuations in stocks is like a low cap rate in real estate. If you buy and hold a piece of real estate with a low cap rate, your returns will be poor unless someone else is willing to pay even more for your real estate and push cap rates even lower).

The following chart illustrates the S&P 500's price/earnings ratio

*This is for estimated earnings (estimated earnings for the current fiscal year).

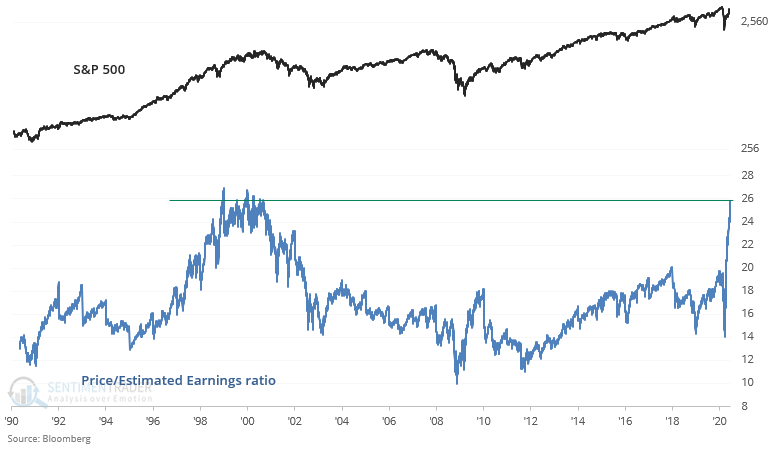
As you can see, valuations today are MUCH higher than in 2009. This isn't to say that stocks ca'tn surge for another 1-2 years: it certainly did from 1998-2000. But high valuations prevent a massive bull market like 2009-2020 from reoccurring.

Sorry, you don't have access to this report

Upgrade your subscription plan to get access
Go to Dasboard
DATA &
TECHnologies
IndicatorEdge
‍
BackTestEdge
‍
Other Tools
‍
DataEdge API
RESEARCH
reports
Research Solution
‍
Reports Library
‍
actionable
Strategies
Trading Strategies
‍
Smart Stock Scanner
‍
FREE
RESOUrCES
Simple Backtest
Calculator
Simple Seasonality
Calculator
The Kelly Criterion
Calculator
Sentiment Geo Map
‍
Public Research Reports
‍
Free Webinar
COMPANY
‍
About
‍
Meet our Team
‍
In the News
‍
Testimonials
‍
Client Success Stories
Pricing
Bundle pricing
‍
Announcements
‍
FAQ
© 2024 Sundial Capital Research Inc. All rights reserved.
Setsail Marketing
TermsPrivacyAffiliate Program
Risk Disclosure: Futures and forex trading contains substantial risk and is not for every investor. An investor could potentially lose all or more than the initial investment. Risk capital is money that can be lost without jeopardizing ones’ financial security or life style. Only risk capital should be used for trading and only those with sufficient risk capital should consider trading. Past performance is not necessarily indicative of future results.

Hypothetical Performance Disclosure: Hypothetical performance results have many inherent limitations, some of which are described below. No representation is being made that any account will or is likely to achieve profits or losses similar to those shown; in fact, there are frequently sharp differences between hypothetical performance results and the actual results subsequently achieved by any particular trading program. One of the limitations of hypothetical performance results is that they are generally prepared with the benefit of hindsight. In addition, hypothetical trading does not involve financial risk, and no hypothetical trading record can completely account for the impact of financial risk of actual trading. for example, the ability to withstand losses or to adhere to a particular trading program in spite of trading losses are material points which can also adversely affect actual trading results. There are numerous other factors related to the markets in general or to the implementation of any specific trading program which cannot be fully accounted for in the preparation of hypothetical performance results and all which can adversely affect trading results.

Testimonial Disclosure: Testimonials appearing on this website may not be representative of other clients or customers and is not a guarantee of future performance or success.