Data &
Technology
Research
Reports
Report Solutions
Reports Library
Actionable
Strategies
Free
Resources
Simple Backtest Calculator
Simple Seasonality Calculator
The Kelly Criterion Calculator
Sentiment Geo Map
Public Research Reports
Free Webinar
Pricing
Company
About
Meet Our Team
In the News
Testimonials
Client Success Stories
Contact
Log inLoginSign up
< BACK TO ALL REPORTS

Imminent Recession (So They Say)

Jason Goepfert
2019-09-04
null

This is an abridged version of our recent reports and notes. For immediate access with no obligation, sign up for a 30-day free trial now.

An unequal month

An index that equally-weights each of the stocks in the S&P 500 badly under-performed the capitalization-weighted version of the index that everyone watches.

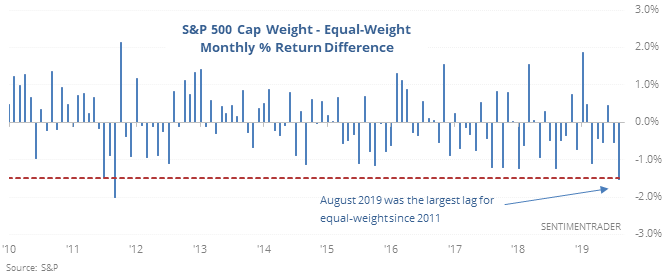
That masks some underlying weakness in the index. But when both indexes fall, with the equal-weight version falling the most, it did not consistently signal future weakness.

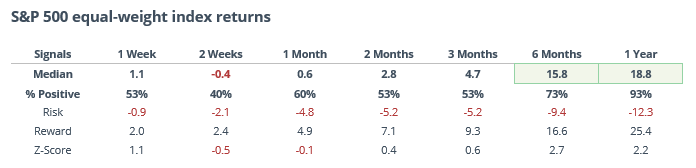
The S&P 500’s returns going forward were a bit weak shorter-term, but strong over the medium- to long-term. That’s for the cap-weighted index that everyone uses. For the equal-weight index, shown below, returns were even weaker shorter-term, but stronger longer-term.

Survey says

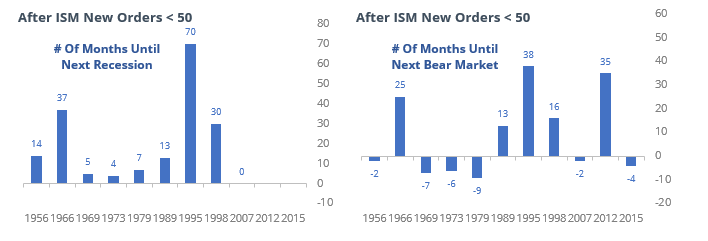
The widely watched ISM Manufacturing and New Orders surveys showed contraction for the first time in several years in August. 

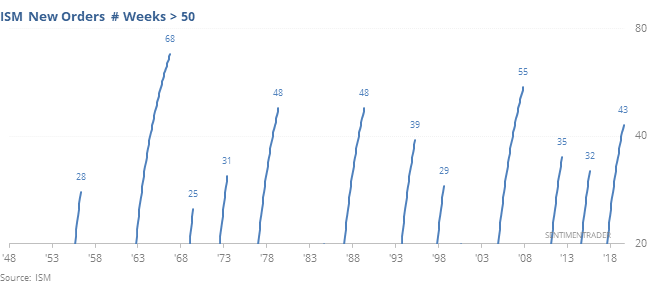
This has triggered a bout of large-font headlines suggesting the U.S. economy is heading into an imminent recession. And these surveys a major input to many recession models, raising the probability of future weakness. But when the surveys slip below 50 after a long period of positive momentum, it has not been a consistent signal of imminent recession, and even less so a looming bear market in stocks.

Exhausted

Last week, 50 companies in the S&P 500 had a selling climax, where they hit a 52-week low then rebounded to close above the prior week’s close. The Backtest Engine shows that the only period when this many selling climaxes led to a negative return was in 2008. The other weeks either preceded gains or smallish, temporary losses.
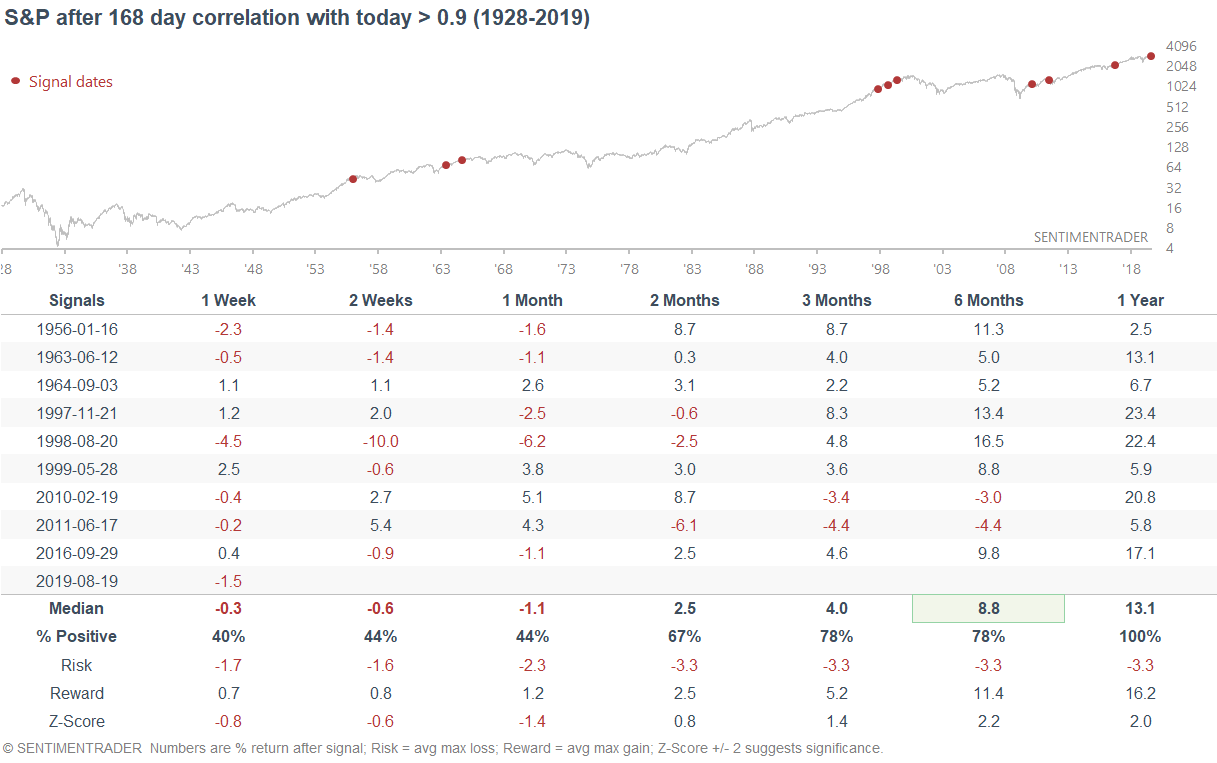
Highly correlated

There has been another bout of “the past 8 months look just like 2007” price charts going around. As Troy noted over the weekend, there have been 9 periods of 168 days with a correlation higher than 90% to the last 168 days (dating back to the end of 2018). A year later, all of them were higher, by an average of 13.1%.
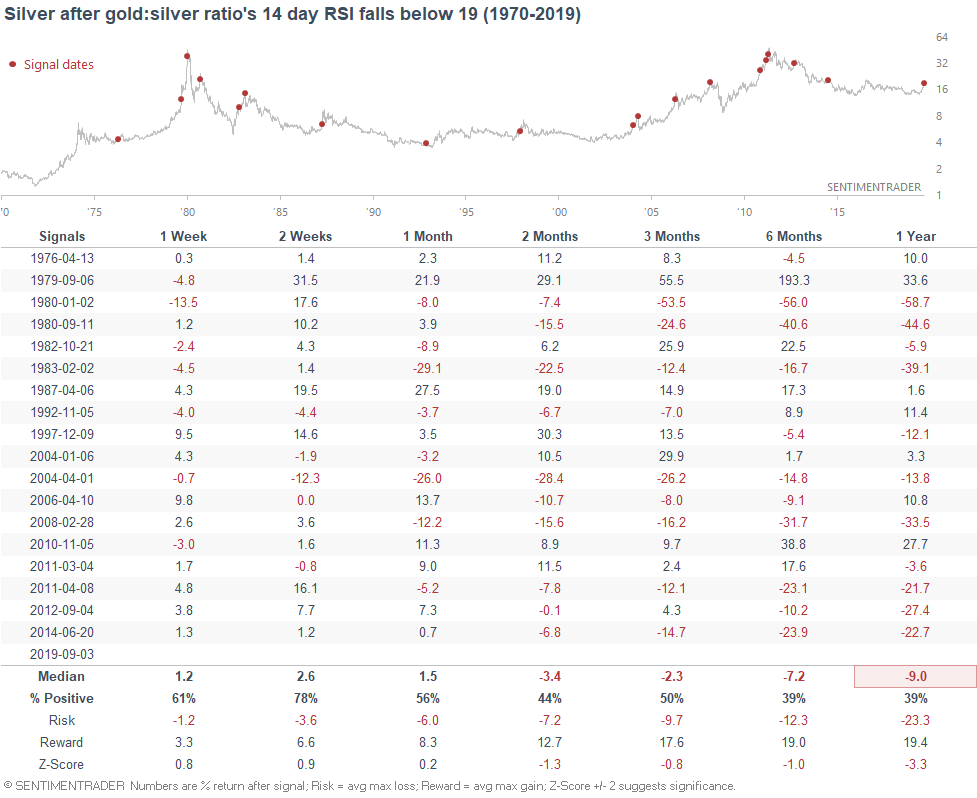
Gold:Silver

Silver continues to play catch-up to gold's rally. Silver surged yesterday, causing the gold:silver ratio to tank.

As a result, the gold:silver ratio's 14 day RSI has fallen to 18, which is extremely low. In the past, this wasn't too good for silver over the next 6-12 months.

DATA &
TECHnologies
IndicatorEdge
‍
BackTestEdge
‍
Other Tools
‍
DataEdge API
RESEARCH
reports
Research Solution
‍
Reports Library
‍
actionable
Strategies
Trading Strategies
‍
Smart Stock Scanner
‍
FREE
RESOUrCES
Simple Backtest
Calculator
Simple Seasonality
Calculator
The Kelly Criterion
Calculator
Sentiment Geo Map
‍
Public Research Reports
‍
Free Webinar
COMPANY
‍
About
‍
Meet our Team
‍
In the News
‍
Testimonials
‍
Client Success Stories
Pricing
Bundle pricing
‍
Announcements
‍
FAQ
© 2024 Sundial Capital Research Inc. All rights reserved.
Setsail Marketing
TermsPrivacyAffiliate Program
Risk Disclosure: Futures and forex trading contains substantial risk and is not for every investor. An investor could potentially lose all or more than the initial investment. Risk capital is money that can be lost without jeopardizing ones’ financial security or life style. Only risk capital should be used for trading and only those with sufficient risk capital should consider trading. Past performance is not necessarily indicative of future results.

Hypothetical Performance Disclosure: Hypothetical performance results have many inherent limitations, some of which are described below. No representation is being made that any account will or is likely to achieve profits or losses similar to those shown; in fact, there are frequently sharp differences between hypothetical performance results and the actual results subsequently achieved by any particular trading program. One of the limitations of hypothetical performance results is that they are generally prepared with the benefit of hindsight. In addition, hypothetical trading does not involve financial risk, and no hypothetical trading record can completely account for the impact of financial risk of actual trading. for example, the ability to withstand losses or to adhere to a particular trading program in spite of trading losses are material points which can also adversely affect actual trading results. There are numerous other factors related to the markets in general or to the implementation of any specific trading program which cannot be fully accounted for in the preparation of hypothetical performance results and all which can adversely affect trading results.

Testimonial Disclosure: Testimonials appearing on this website may not be representative of other clients or customers and is not a guarantee of future performance or success.