Products
SentimenTrader Trading Tools
‍
Backtest Engine
My Trading Toolkit
Correlation Analysis
Seasonality
Indicators & Data API
‍
Proprietary Indicators & Charts
Market Data API
Strategies & Scanner
‍
50+ Trading Strategies
Smart Stock Scanner
Research Reports
‍
Research Solutions
Reports Library
Free Resources
Simple Backtest Calculator
Simple Seasonality Calculator
The Kelly Criterion Calculator
Sentiment Geo Map
Public Research Reports
Education
Sentiment Indicators
Technical Indicators
Pricing
Company
About
In the News
Testimonials
Client Success Stories
Contact
Log inLoginSign up
< BACK TO ALL REPORTS

If you didn't enjoy the first half of September...

Jay Kaeppel
2022-09-19
September is the only month that has historically shown a net loss. Even so, it still shows a gain more often than most investors realize. However, there is one part of the month when investors should be prepared for the worst.

Key points:

  • September is widely recognized as the poorest performing month for the stock market
  • It is a mistake to assume that the market will decline simply because the month happens to be September
  • A lesser-known fact is that weakness is much more common during the last ten trading days of September

September as a whole

We use S&P 500 Index daily price data for testing starting in 1920. The chart below displays the cumulative percentage return for SPX held long only during September each year beginning in 1920, and the table summarizes monthly results.

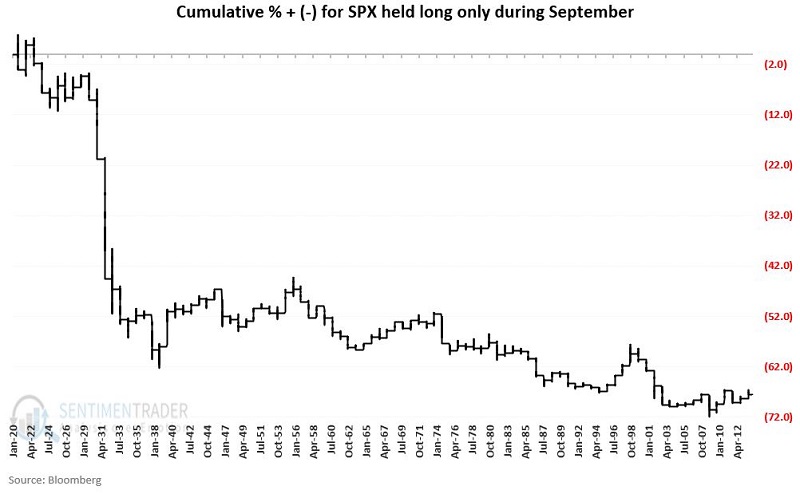
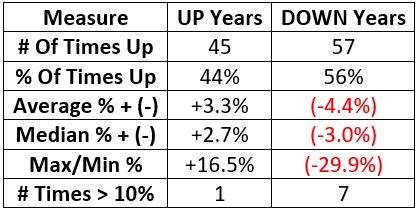
The overall results are not good. Nevertheless, a 44% Win Rate means it is a mistake to stick one's head in the sand merely because the calendar reads September. To find something potentially more useful, let's take a closer look at Intra monthly returns.

The first part of September

We will define "the first part" of September as every trading day before the last ten trading days of the month. The chart below displays the cumulative return for SPX held long-only all trading days in September before the last ten trading days. The table summarizes the results.

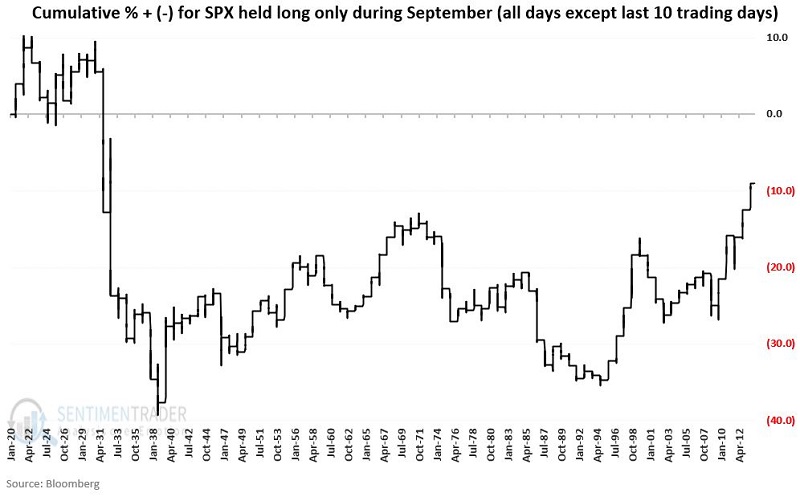
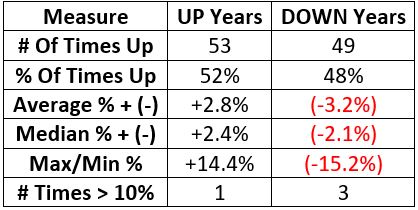
Note that the Win Rate for September before the last ten trading days of the month is above 50%. Still essentially a coin-flip but not necessarily a reason to bail out of stocks.

The latter part of September

We will define "the latter part" of September as the last ten trading days of the month. The chart below displays the cumulative return for SPX held long only during the last ten trading days of September, and the table summarizes the results.

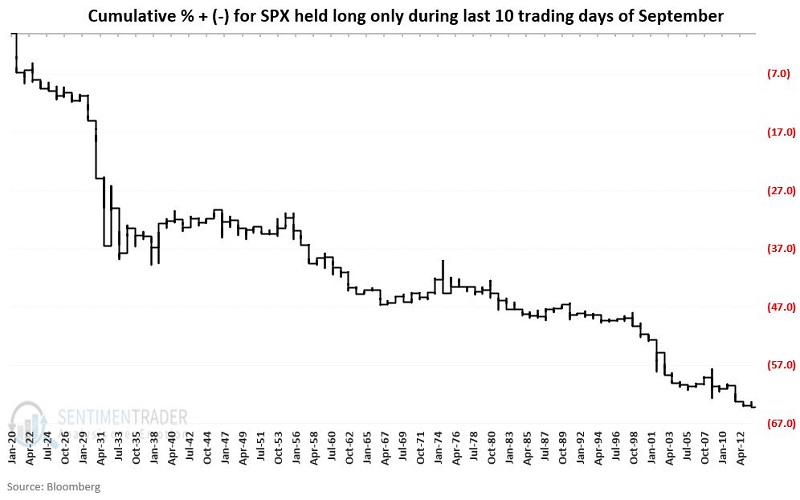
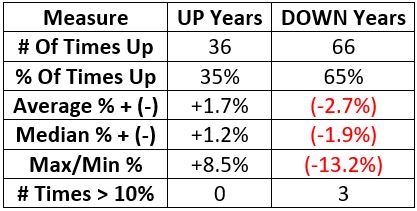
Note the persistent long-term downtrend in the chart above. If a time of year invites hedging, this would be it.

What the research tells us…

It is a mistake to assume that the stock market will decline simply because the calendar reads September. However, long-term results suggest that caution is clearly in order during September - particularly when we get to the last ten trading days of the month. 

For 2022, this particularly unfavorable period extends from the close on 2022-09-16 through the close on 2022-09-30.

Sorry, you don't have access to this report

Upgrade your subscription plan to get access
Go to Dasboard
PRODUCTS
SentimenTrader
Trading Tools
Indicators & Data API
‍
Strategies & Scanner
‍
Research Reports
FREE
RESOUrCES
Simple Backtest
Calculator
Simple Seasonality
Calculator
The Kelly Criterion
Calculator
Sentiment Geo Map
‍
Public Research Reports
‍
Education
Sentiment Indicators
‍
Technical Indicators
‍
Pricing
Bundle pricing
‍
FAQ
‍
Announcements
‍
COMPANY
‍
About
‍
In the News
‍
Testimonials
‍
Client Success Stories
CONTACT
‍
General Inquiries
‍
Media Inquiries
‍
Financial Professionals Inquiries
‍
© 2025 Sundial Capital Research Inc. All rights reserved.
Setsail Marketing
TermsPrivacyAffiliate Program
Risk Disclosure: Futures and forex trading contains substantial risk and is not for every investor. An investor could potentially lose all or more than the initial investment. Risk capital is money that can be lost without jeopardizing ones’ financial security or life style. Only risk capital should be used for trading and only those with sufficient risk capital should consider trading. Past performance is not necessarily indicative of future results.

Hypothetical Performance Disclosure: Hypothetical performance results have many inherent limitations, some of which are described below. No representation is being made that any account will or is likely to achieve profits or losses similar to those shown; in fact, there are frequently sharp differences between hypothetical performance results and the actual results subsequently achieved by any particular trading program. One of the limitations of hypothetical performance results is that they are generally prepared with the benefit of hindsight. In addition, hypothetical trading does not involve financial risk, and no hypothetical trading record can completely account for the impact of financial risk of actual trading. for example, the ability to withstand losses or to adhere to a particular trading program in spite of trading losses are material points which can also adversely affect actual trading results. There are numerous other factors related to the markets in general or to the implementation of any specific trading program which cannot be fully accounted for in the preparation of hypothetical performance results and all which can adversely affect trading results.

Testimonial Disclosure: Testimonials appearing on this website may not be representative of other clients or customers and is not a guarantee of future performance or success.