
Households Have Never Been More Exposed

Consumers are flush, and they've got a whole lot riding on markets.
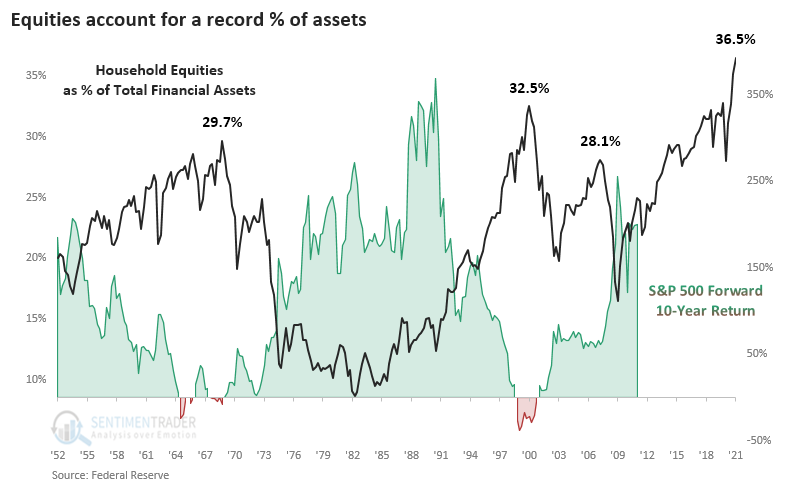
The latest Federal Reserve data on household assets, just released with a delay for Q1, shows that once again, equities have pushed to a record relative to all household financial assets. At 36.5% of all assets, mutual funds and equities account for a greater share than any point since at least 1952.
The chart below shows this measure against the S&P 500's return over the next decade. There has been a clear negative correlation, meaning that as households allocate more of their assets to stocks, future returns on those stocks decrease.
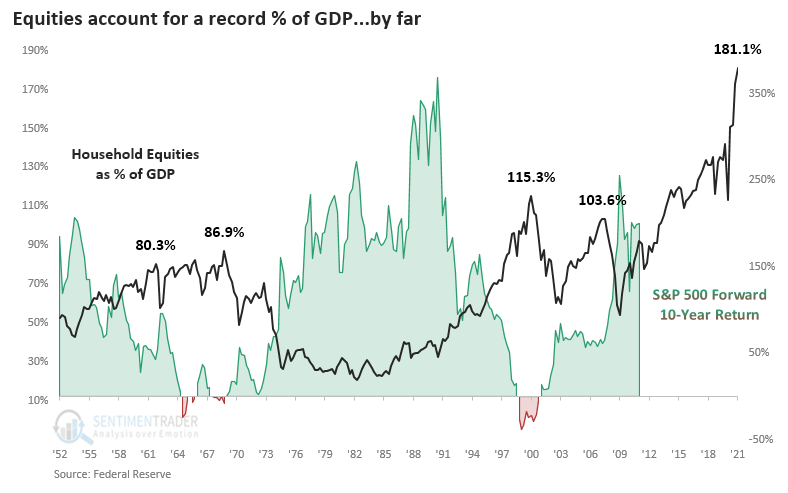
A similar look at the data shows the thing but in an even more extreme way. Relative to the country's output, stock holdings have soared and far surpass any historical extreme. Of course, it's been this way since 2015, so anyone using it as a bearish crutch has been hurting.
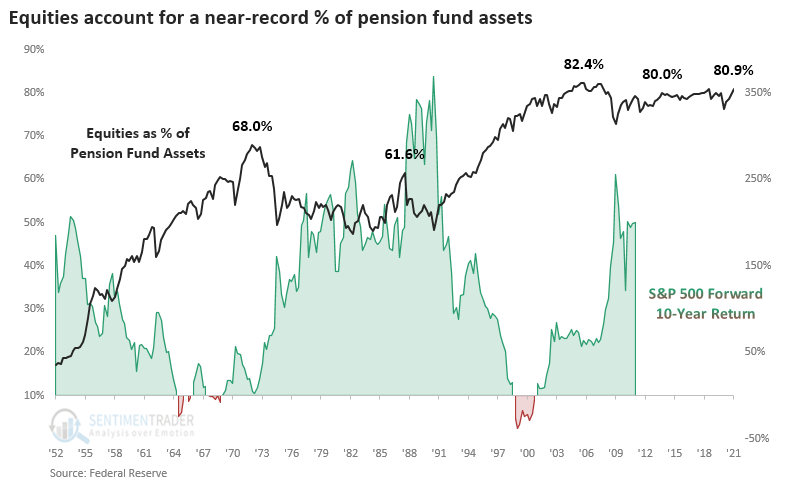
One of the largest asset allocators in the market, pension funds, also picked up their stock exposure. At nearly 81% of all assets, funds are nearing a record allocation to stocks. There hasn't been as consistent a negative correlation between these allocations and stocks' long-term forward returns, and it hasn't moved much in the past 20 years, gyrating between 70% - 83% of assets.
CORRELATIONS AND FORECASTS
If we focus on the first two charts, then the table below shows their correlation to the S&P 500's future returns across various time frames. There was a negative, but weak, correlation to returns up to a year later, then it increases consistently with the highest correlation being to 10-year returns.
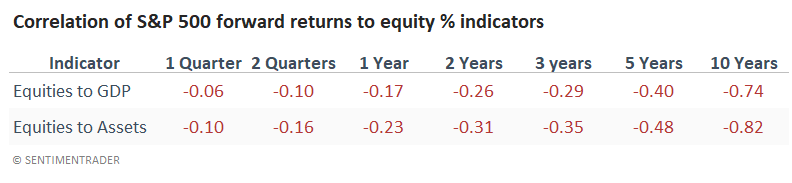
If we use these correlations to estimate the S&P's returns in the quarters ahead, then it's not a pretty picture. This should be a surprise since the indicators are at all-time highs.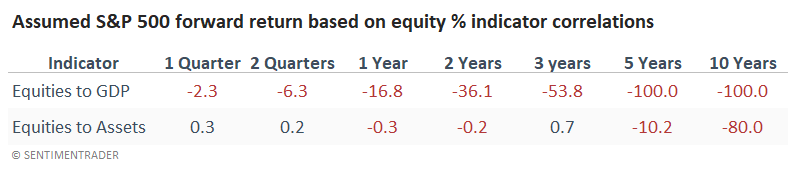
Taking this literally would be silly. Stocks probably aren't going to zero just because households have a record amount of assets allocated to them. It's just a reminder that high allocations to any asset tend to precede poor returns in that very asset. Given the record allocations to stocks in Q1, which likely got even more extreme in Q2, it's a sobering thought that traders might have more of an advantage than investors in the years ahead.
NOT ANY SAFE HAVENS
There weren't many sectors that did well after peaks in the Equity / GDP Ratio. It's not a big surprise that the ones that held up the best tended to be more defensive. Returns in the table are shifted forward by one quarter to account for lag in the data.
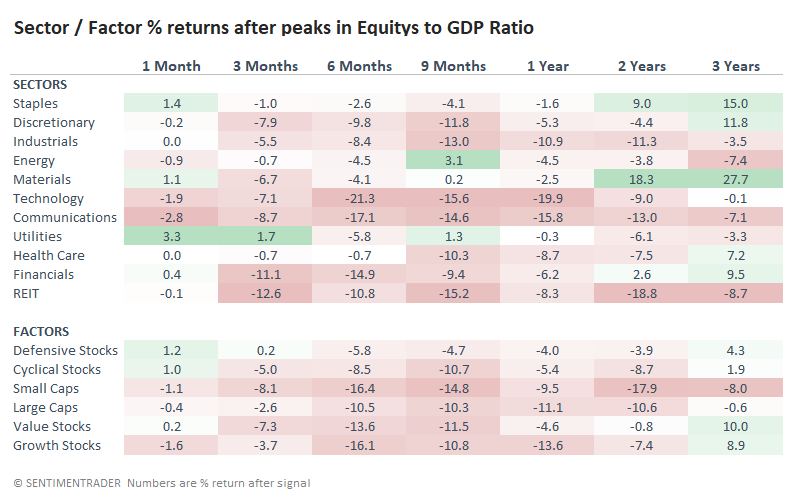
Most of the "least bad" returns were in Staples, Energy, and Utilities. The worst were in Industrials, Technology, Communications, and REITs.
We don't know if these stock allocations have peaked - it's almost certain that they have not. So it's premature to rely too much on these results. And while it's been a worry for while, the record allocations to stocks is becoming even more concerning with each release. Perhaps it won't matter as much since household balance sheets are in good condition, with high cash levels and relatively low debt service ratios, allowing them to take a loss on investments without panic-selling. But that gets into guessing, and we'd rather just take the data as it comes.