
Historic underperformance by the average stock

Key points:
- The equal-weight version of the S&P 500 had a one-year return nearly 20% less than the capitalization-weight version
- That's the 2nd-widest spread since 1958 and has shown some signs of reversing
- Similar behavior only happened a handful of times but preceded future outperformance of the average stock
A new extreme in rolling returns
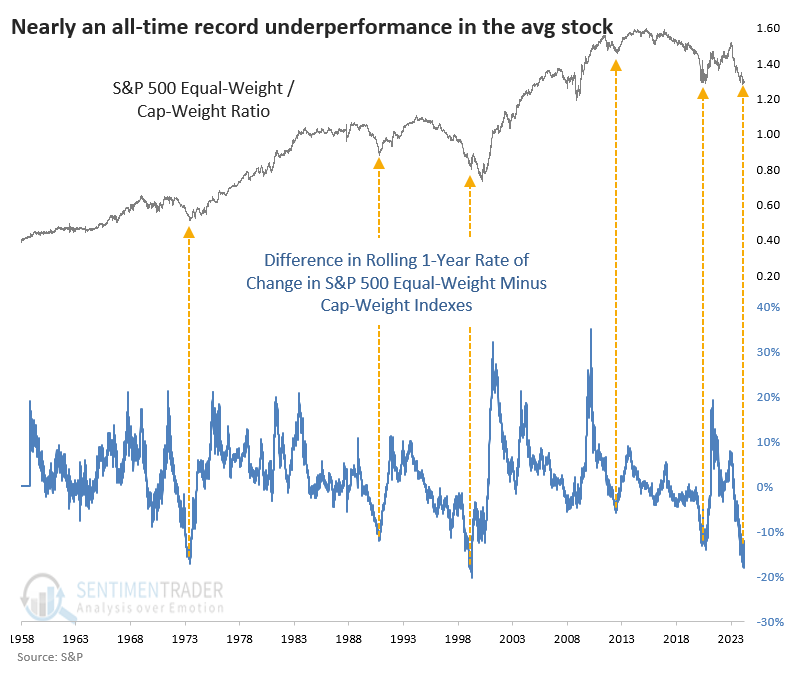
Last May, we looked at how much the average stock had underperformed the index in the S&P 500. The ratio between the S&P equal-weight index that weights each member stock equally had plunged relative to the more commonly referenced capitalization-weighted index.
The suggestion from that extreme was that the equal-weight version of the index should rebound relative to the cap-weighted over the next year. Looks like that's going to fail heartily.
The relationship has gotten significantly more stretched, historically so. The equal-weight S&P's rolling one-year return is just over +20%, while the cap-weight version is more than +32%. That would mark one of the widest differences since 1958 in rolling one-year returns between the two index versions.
It was even more stretched a few weeks ago. The spread in rolling one-year returns between the two versions has only got that stretched one other time - in the spring of 1999, as the internet bubble inflated some high-flying tech stocks. The concern this time is that .ai is the new .com.
It's easy to draw lines on a chart after the fact. It's much harder to know in real-time whether the extreme has turned or will simply revert back and become even "extreme." So, we must have some reasonable rule to use in real-time to believe that something has changed.
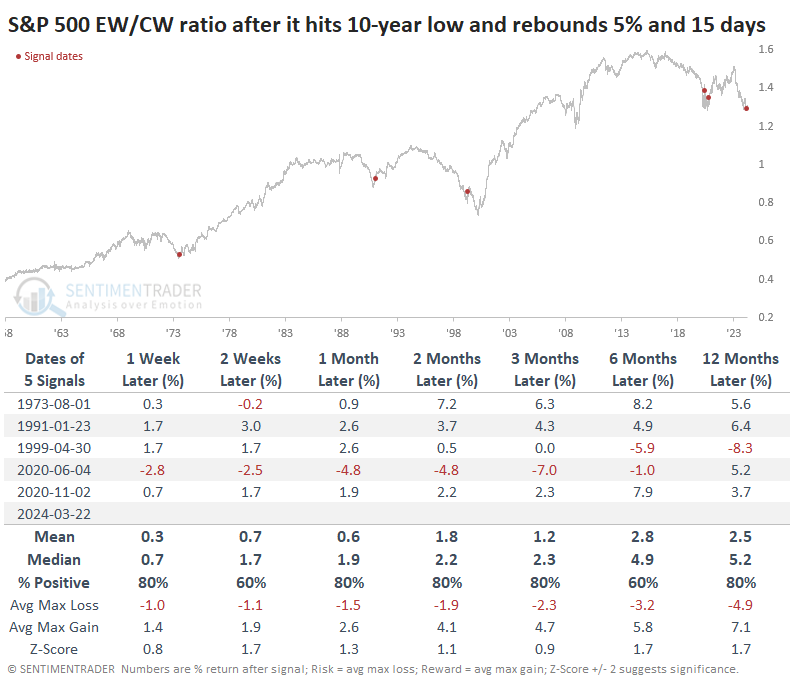
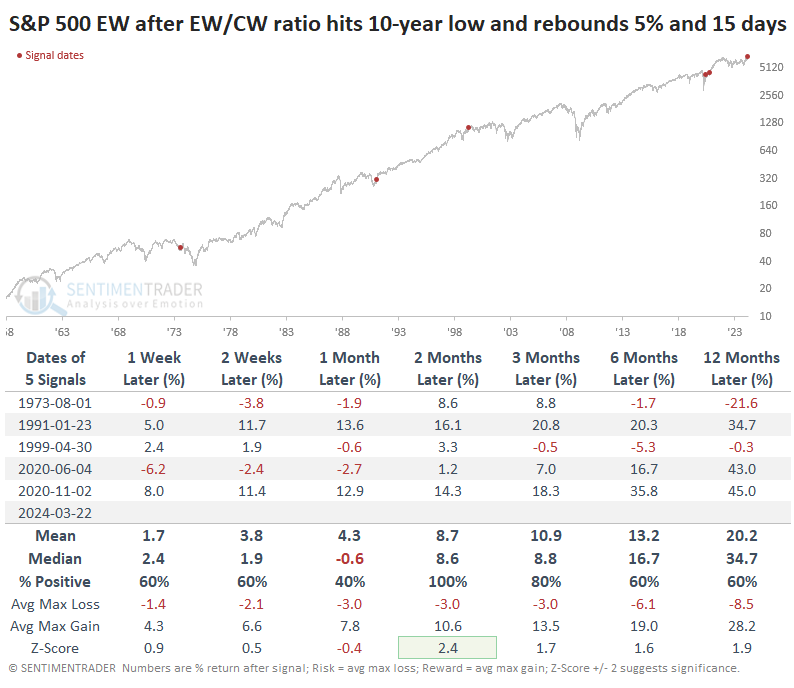
In this case, we'll require that the spread between the two versions' rolling one-year returns has to go at least 15 days since hitting a ten-year low and revert by at least 5%. That would give us some support that the extreme has run its course. It just triggered last week for the first time since the pandemic.
Mean reversion in rolling return reversals
The table below shows how the ratio between the equal-weight (EW) and capitalization-weight (CW) versions of the S&P 500 index performed after similar reversals from an extreme in rolling one-year returns. The reversal rule turned out to be a short-term fake-out in the aftermath of the pandemic rebound. It fell to another 10-year low, then rebounded again, triggering a lasting reversal. The others did as well, though in 1999, there was one more dive lower over the medium- to long-term.
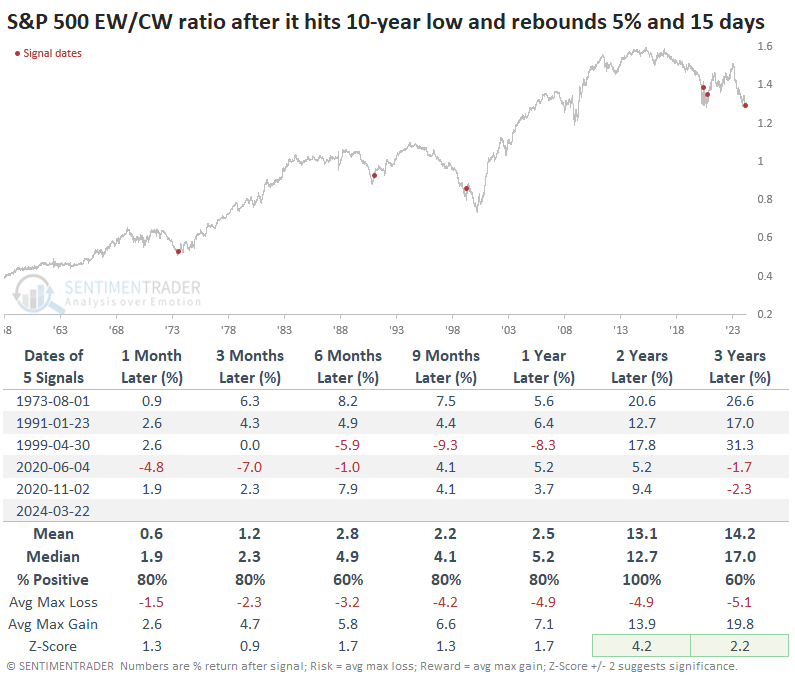
The table below shows the same signals but over more extended time frames. We can see that the equal-weight index outperformed the cap-weight version during the next two years after each signal.
In terms of absolute returns instead of relative ones, the following table shows returns in the commonly quoted S&P 500 index after these signals. It gained over the next two months after each signal and had only a single loss after three months, but the 1973 signal triggered early in the wicked 1974 bear market.
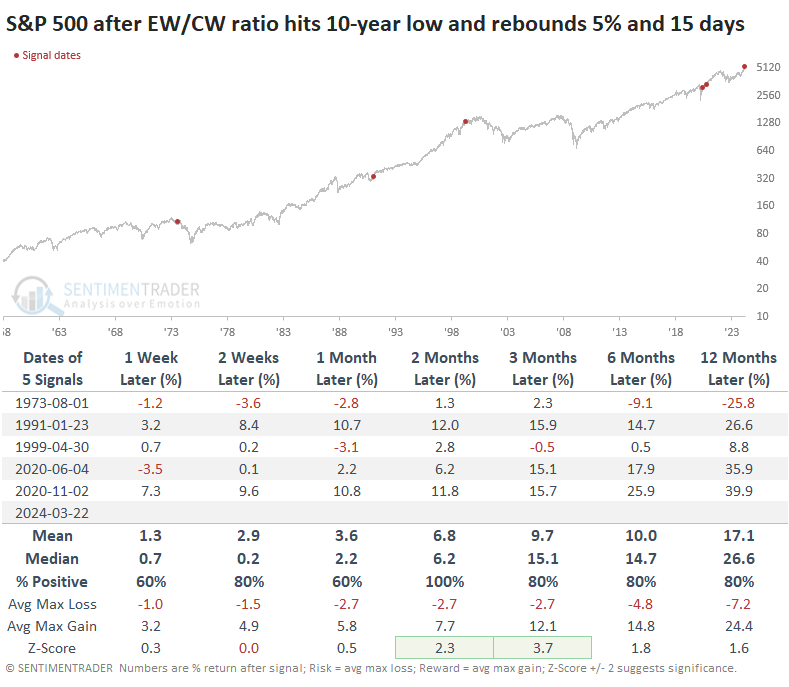
The equal-weight version of the index showed even better returns over the next couple of months. It suffered more than the cap-weight index initially ahead of the popping of the internet bubble, but it lost less in the long term. It also suffered significantly less during the 1974 bear market.
What the research tells us...
It's always dicey dealing with tiny sample sizes. There can be value in doing so, especially if the conclusions are consistent. Nothing is ever perfect, even with statistically significant samples - it's just harder to have confidence.
That proved to be the case last May and may once again. An extreme development ended up becoming yet more extreme, and that raises the probability we're dealing with a structural issue that will overwhelm any other factor. It's impossible to know. All we can know for sure is that investors have behaved similarly a handful of times over the past 65 years, and each time, it was relatively close to an infection point for the average stock relative to the big boys pushing the cap-weight indexes to new highs.