Data &
Technology
Research
Reports
Report Solutions
Reports Library
Actionable
Strategies
Free
Resources
Simple Backtest Calculator
Simple Seasonality Calculator
The Kelly Criterion Calculator
Sentiment Geo Map
Public Research Reports
Free Webinar
Pricing
Company
About
Meet Our Team
In the News
Testimonials
Client Success Stories
Contact
Log inLoginSign up
< BACK TO ALL REPORTS

Historic Streaks of Momentum Skid to a Halt

Jason Goepfert
2021-10-04
The S&P 500 finally ended a historic streak of sessions within 5% of its last 52-week high.

Investors had a tough month as September worked its usual spell of being difficult to navigate for bulls.

With a loss to end the month, the S&P 500 finally ended its streak of 227 days of being within 5% of a 52-week high. That was the 8th-longest streak of being within 5% of a high since 1928. 

S&P 500 days since 5% pullback

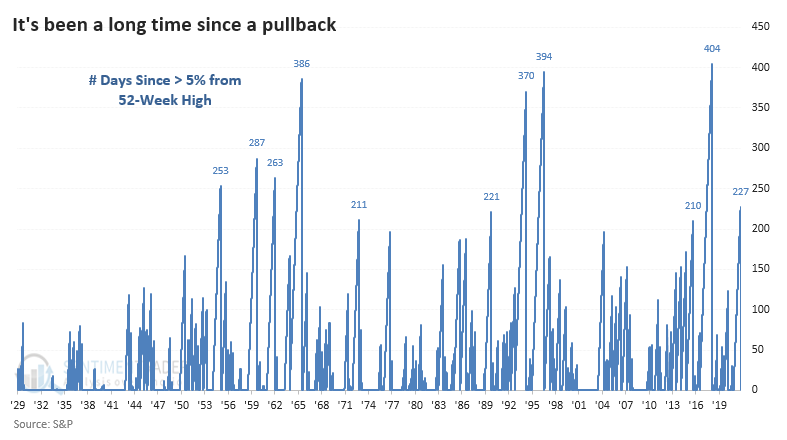
There were 10 total instances of it going more than 200 days without much of a pullback, and the ends of those streaks were not a good reason to sell. Over the next two months, the index rebounded 9 of the 10 times, with the only loss being less than 2%. Momentum does not die easily, as investors see their first real opportunity to get in after avoiding chasing stocks higher.

The S&P also ended its long streak of positive months. It was the first lower monthly close in 7 months. That's not its longest streak but is one of the longer ones when trading at an all-time high.

After the ends of other long streaks of up months, the S&P did even better than it did after not suffering even a 5% pullback. Its returns across almost all time frames were well above random, with a highly positive risk to reward ratio.


What else we're looking at

  • Full returns following an end to a long streak without a 5% pullback
  • What happens after the first down month after a long streak of positive ones
  • Why the bond market faces some headwinds in the coming weeks

Stat box

On Friday, 80% of health care stocks fell to a one-month low. Over the past 22 years, only 25 other days have seen so many of the stocks falling to that extreme at the same time.

Etcetera

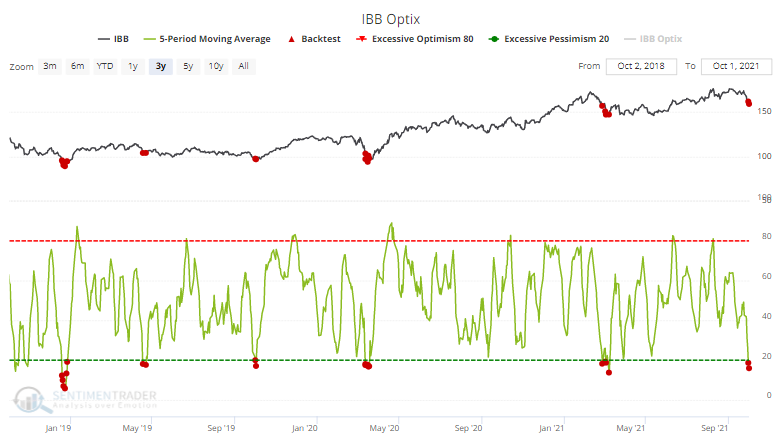
Bio-wreck. The Optimism Index on the IBB biotech fund has averaged less than 20% over the past five days. That's among the lowest readings of the past 3 years.

ibb biotech optimism index sentiment

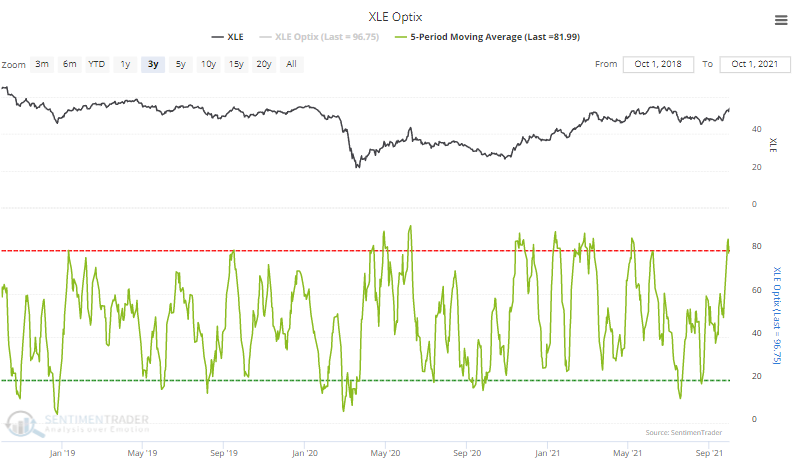
Energy enthusiasm. At the other end of the spectrum, the highest Optimism Index over the past week is in the XLE energy fund.

xle energy optimism index sentiment

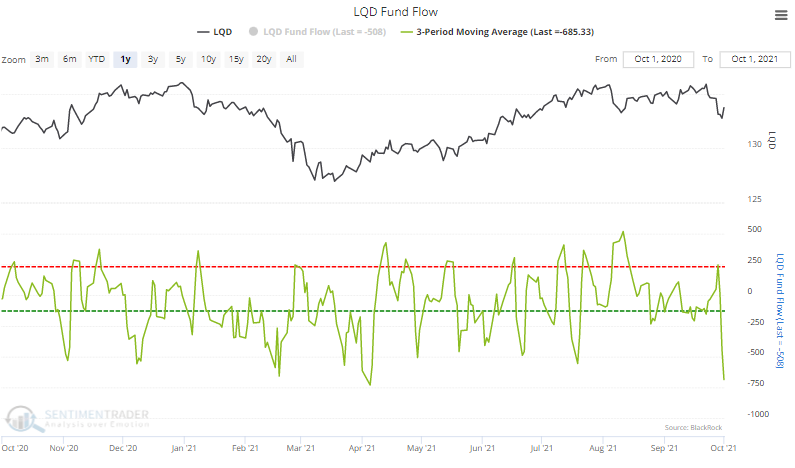
Leaving liquid liabilities. Over the past three sessions, the LQD investment-grade bond fund has leaked an average of $685 million in assets. That's the 2nd-largest average outflow in the fund's history.

lqd bond fund outflow

DATA &
TECHnologies
IndicatorEdge
‍
BackTestEdge
‍
Other Tools
‍
DataEdge API
RESEARCH
reports
Research Solution
‍
Reports Library
‍
actionable
Strategies
Trading Strategies
‍
Smart Stock Scanner
‍
FREE
RESOUrCES
Simple Backtest
Calculator
Simple Seasonality
Calculator
The Kelly Criterion
Calculator
Sentiment Geo Map
‍
Public Research Reports
‍
Free Webinar
COMPANY
‍
About
‍
Meet our Team
‍
In the News
‍
Testimonials
‍
Client Success Stories
Pricing
Bundle pricing
‍
Announcements
‍
FAQ
© 2024 Sundial Capital Research Inc. All rights reserved.
Setsail Marketing
TermsPrivacyAffiliate Program
Risk Disclosure: Futures and forex trading contains substantial risk and is not for every investor. An investor could potentially lose all or more than the initial investment. Risk capital is money that can be lost without jeopardizing ones’ financial security or life style. Only risk capital should be used for trading and only those with sufficient risk capital should consider trading. Past performance is not necessarily indicative of future results.

Hypothetical Performance Disclosure: Hypothetical performance results have many inherent limitations, some of which are described below. No representation is being made that any account will or is likely to achieve profits or losses similar to those shown; in fact, there are frequently sharp differences between hypothetical performance results and the actual results subsequently achieved by any particular trading program. One of the limitations of hypothetical performance results is that they are generally prepared with the benefit of hindsight. In addition, hypothetical trading does not involve financial risk, and no hypothetical trading record can completely account for the impact of financial risk of actual trading. for example, the ability to withstand losses or to adhere to a particular trading program in spite of trading losses are material points which can also adversely affect actual trading results. There are numerous other factors related to the markets in general or to the implementation of any specific trading program which cannot be fully accounted for in the preparation of hypothetical performance results and all which can adversely affect trading results.

Testimonial Disclosure: Testimonials appearing on this website may not be representative of other clients or customers and is not a guarantee of future performance or success.