
HiLo Logic Index suggests the wash out is about done

In late January, there were a lot of technical warning signs that had been building. Granted, they had triggered the prior November as well, and failed to precede any weakness, so it was a little harder to trust them when they triggered again in January and early February.
One of the primary warnings was that even though stock indexes were rising, the stocks that were underlying the indexes were becoming split. By the end of January, there were so many stocks hitting 52-week highs and stocks hitting 52-week lows that it caused the HiLo Logic Index (HLLI) to exceed its warning threshold. That has consistently preceded very poor medium-term returns.
Now, we're seeing the opposite.
The HLLI for the NYSE and Nasdaq have both dropped to an extremely low level. This happens when there is either an overwhelming number of securities hitting new highs or new lows. One side of the market is dominant. We already know that right now, there have been a lot of 52-week lows, so it suggests that the market is washed out.
What we're looking for is green shoots - when markets go from really bad to less bad. In the coming days, the HLLI for both the NYSE and Nasdaq will almost certainly turn higher, giving the first hints that we're entering the "less bad" phase.
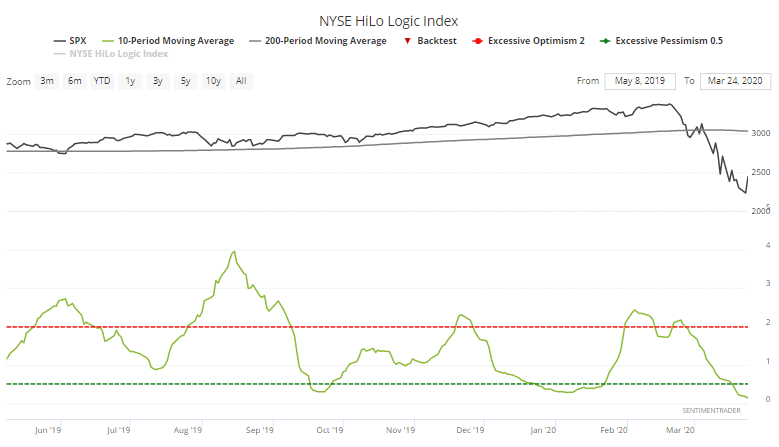
On the NYSE, the 10-day average of the HLLI is close to bottoming out below 0.25, one of the lowest readings on record, due to the overwhelming number of 52-week lows over the past couple of weeks.
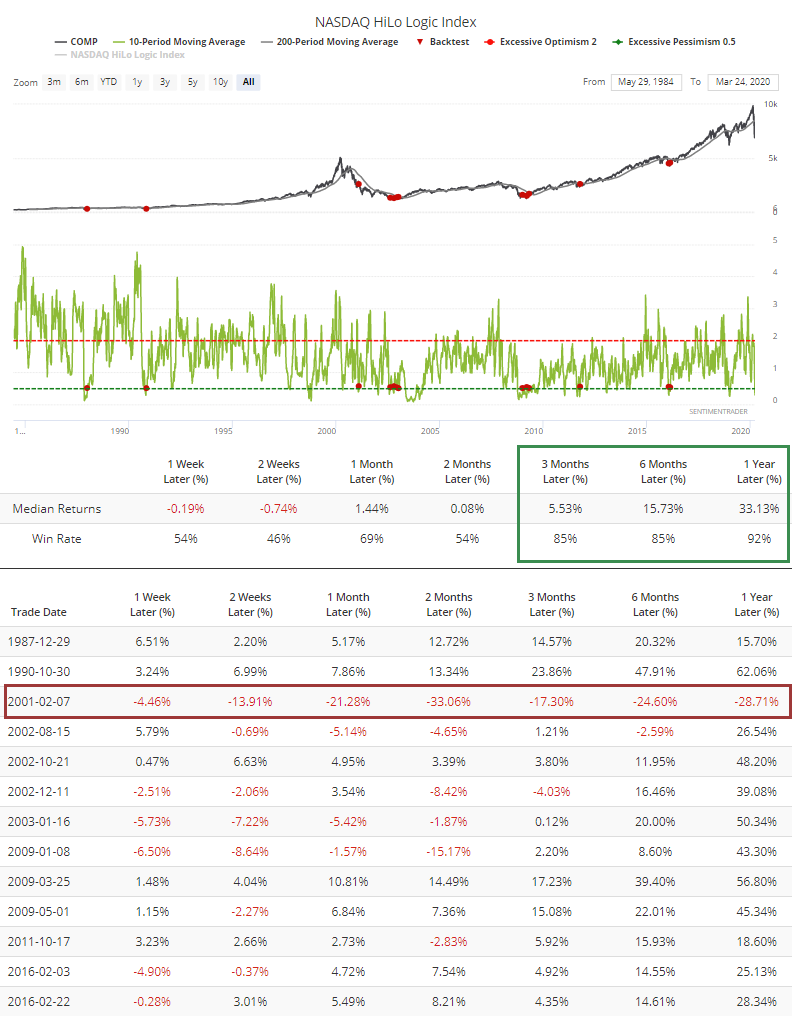
We can use the Backtest Engine to see what happened in prior cycles once the 10-day HLLI reached an extremely low level and turned up. We want to test similar environments, so we'll restrict the test to those times when the S&P 500 was below a downward sloping 200-day average.
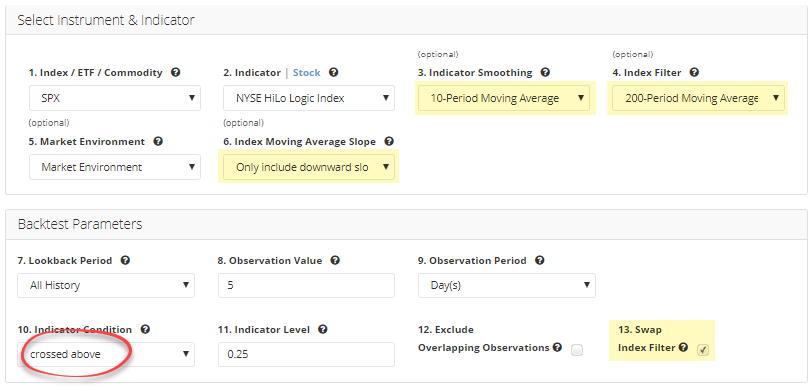
We want to see times when the indicator started to recover, so we'll select "crossed above" to find times when the moving average started to turn higher. To run this test, just click this link then the Run Backtest button.
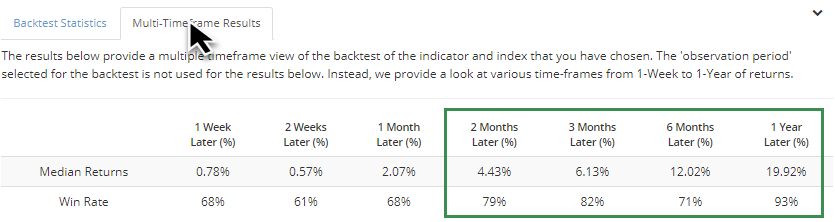
When we do that, the Multi-Timeframe Results tab shows very good longer-term returns. A year later, there were only 2 losses.
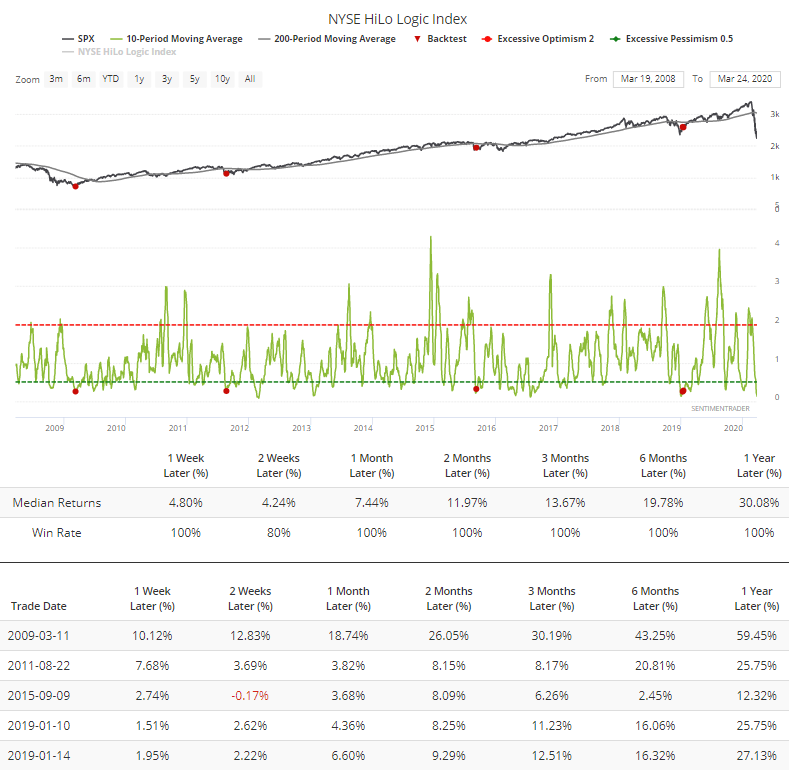
There haven't been too many recent occurrences, but in the past 20 years, results were pristine.
If we perform a similar test on the Nasdaq's HLLI, then we get similar results. A year later, the Composite averaged a return of more than 33%, though there was a big loss in early 2001.
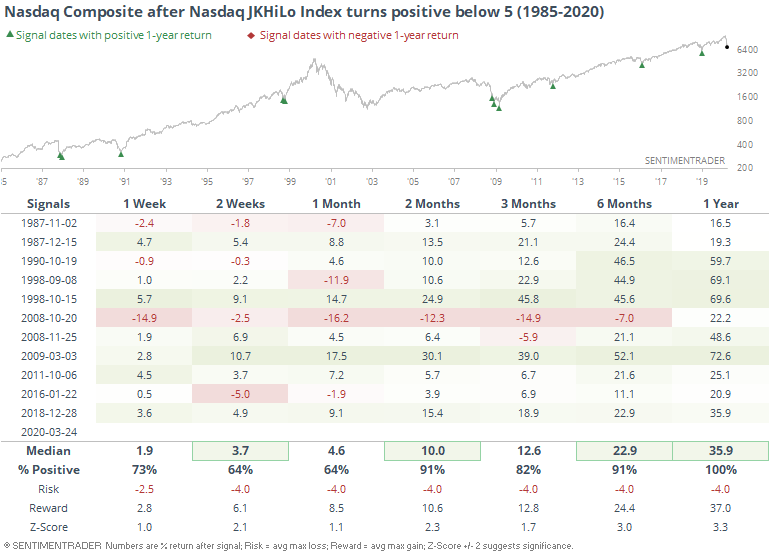
Author and portfolio manager Jay Kaeppel often has unique twists on various methodologies, and he noted that a custom combination of the HiLo Logic Index with a similar index from Gerald Appel just gave a buy signal on the Nasdaq.
We get slightly different results, but most of the dates are the same, and one-year forward returns were impressive, to say the least. It did cause some shorter-term indigestion a few times, so it took some fortitude to hold out longer-term.
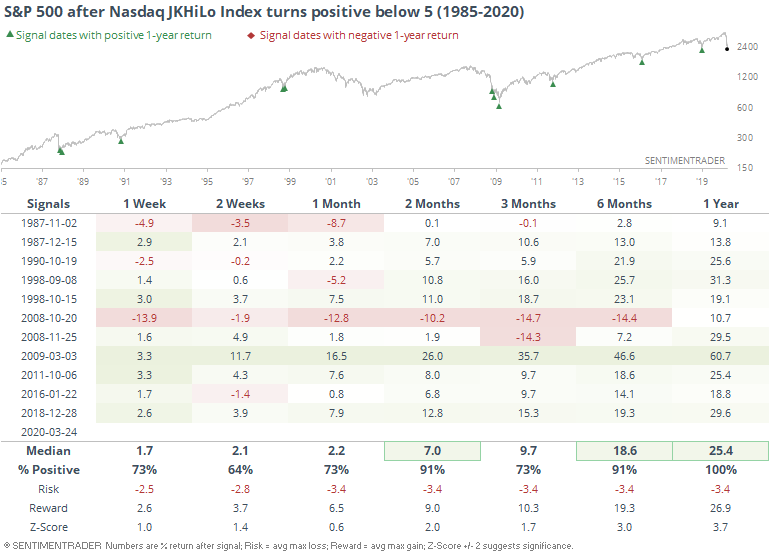
Returns were also impressive for the S&P 500 after these signals.
Extreme can always get more extreme, and cautious investors tend to wait until there is some sign of recovery once indicators get stretched. That can improve the win rate, but it also tends to lower the average returns and often increases shorter-term volatility. While it's still a little early, there are signs that sentiment - and breadth - is just starting to recover from extremely washed out levels, and that has been a longer-term positive.