
High-yield bonds trigger a golden cross buy signal

Key points:
- The advance-decline line for high-yield bonds registered a golden cross buy alert, signaling risk-on for stocks
- Golden cross signals produced excellent returns for the S&P 500, especially compared to death cross periods
Economically sensitive high-yield bonds flash a green light for stocks
Over the past several months, our research reports have extensively covered the positive outlook for the stock market, examining index trends, market breadth, financial conditions, volatility, and several other factors.
One critical driver of the improvement in the stock market has been bond yields, as they have fallen sharply, with the FOMC signaling a pause in the interest hiking cycle.
With Treasury yields reversing from uptrends to downtrends, high-yield bonds, the most economically sensitive category in corporate credit, surged higher, producing a bullish market breadth backdrop. That was especially the case for the spread between 52-week highs and lows for high-yield bonds, which recently increased to the highest level in history.
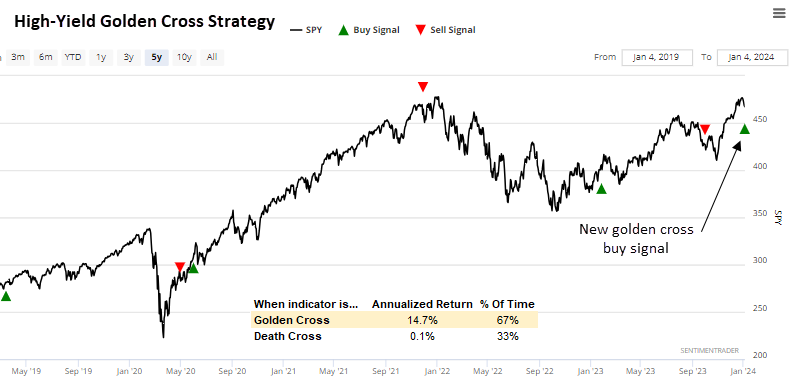
On Thursday, the high-yield bond landscape gained additional encouraging news as the advance-decline line triggered a golden cross buy signal. A golden cross occurs when the advance-decline line 50-day moving average crosses above the 200-day average, indicating more high-yield bonds are rising than falling.
You can track this signal by visiting the Sentimentrader website, specifically on our Strategies page. The strategy applies the high-yield golden and death cross signals to the S&P 500 to gauge whether the stock market is currently in a risk-on or risk-off environment.
When high-yield bonds trigger a golden cross alert, the S&P 500 produces an impressive 14.7% annualized return. Conversely, a death cross signal reduces the world's most benchmarked index to an annualized return of only 0.01%.
The Golden Cross strategy participates in the upside while avoiding the downside
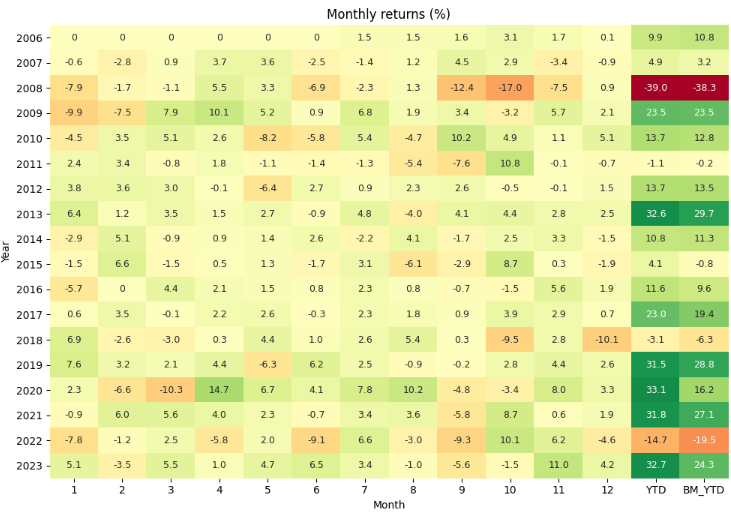
While the strategy slightly outperforms buy-and-hold, with a CAGR of 8.85% versus 7.79% for the S&P 500, the true value lies in its ability to sidestep substantial drawdowns.
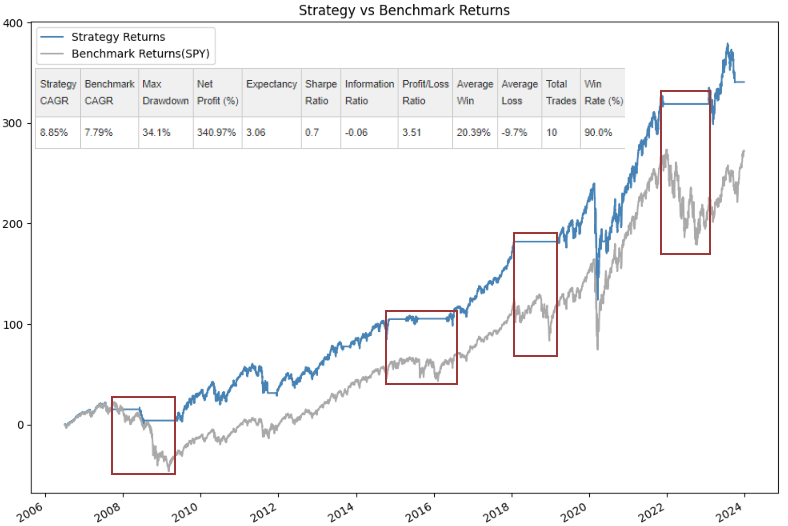
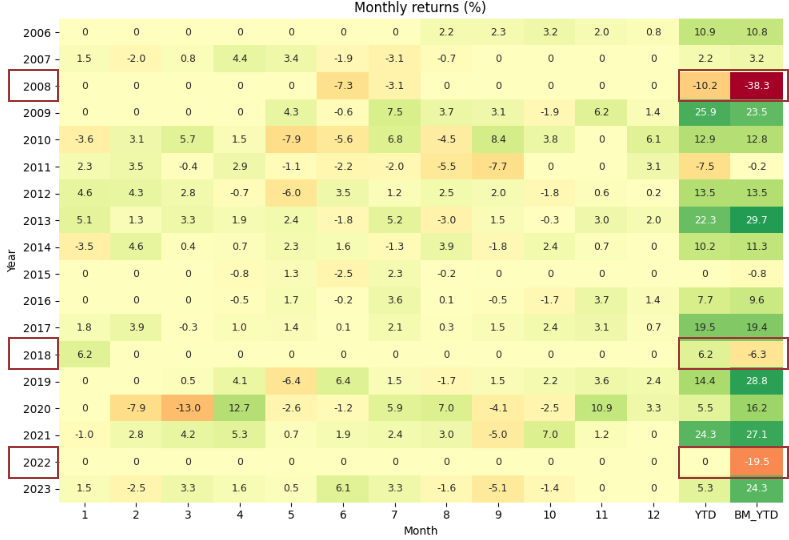
The avoidance of significant drawdowns was clearly evident in 2008, 2018, and 2022. In case you were wondering, the YTD and benchmark YTD columns are new additions to the monthly returns table.
A suite of index-based strategies for assessing technical and fundamental factors
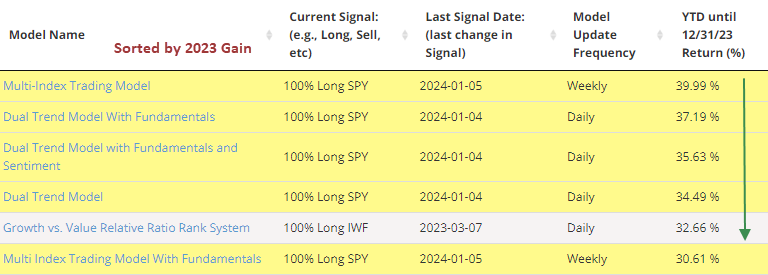
As we state on the Website, not all strategies will perform well in a given year as styles and factors go in and out of favor. However, a few models have solid track records, like the Multi-Index Trading Model, which gained 40% in 2023.
In some cases, like the high-yield golden cross strategy, it's more about the overall market message being conveyed by high-yield bonds.
A new strategy
In case you missed it, we added a growth versus value relative strength timing model to our strategies suite in 2023. The strategy has maintained its winning streak, outperforming its benchmark for the ninth consecutive year and achieving success in 14 out of the 17 years since its first full calendar year in 2007.
What the research tells us...
Market breadth for high-yield bonds suggests broad upside participation, and that's a good thing for stocks. When a high-yield golden cross signal occurs, the S&P 500 shows an annualized return of 14.7% versus only 0.01% when a death cross alert materializes. You can monitor the High-Yield Golden Cross model and several other systems on our strategies page to keep abreast of what technical and fundamental factors are in or out of favor.