High Yield and Investment Grade Bond Update

I want to provide a quick update on what I'm seeing with my corporate bond timing models for high yield and investment-grade indexes in today's note.
THE CONCEPT
The corporate bond timing models use market breadth measures from FINRA TRACE to identify trend changes in advance of price action alone.
COMPONENTS
- Advancing Issues
- Declining Issues
- New Highs
- New Lows
ENTRY SIGNALS
- Breadth thrust
- Advance-Decline line moving average golden cross with positive index momentum
- New highs vs. new lows spread cross above a threshold level
EXIT SIGNALS
- Advance-Decline line moving average death cross with negative index momentum
- Advance-decline divergence
- New highs vs. new lows spread cross below a threshold level
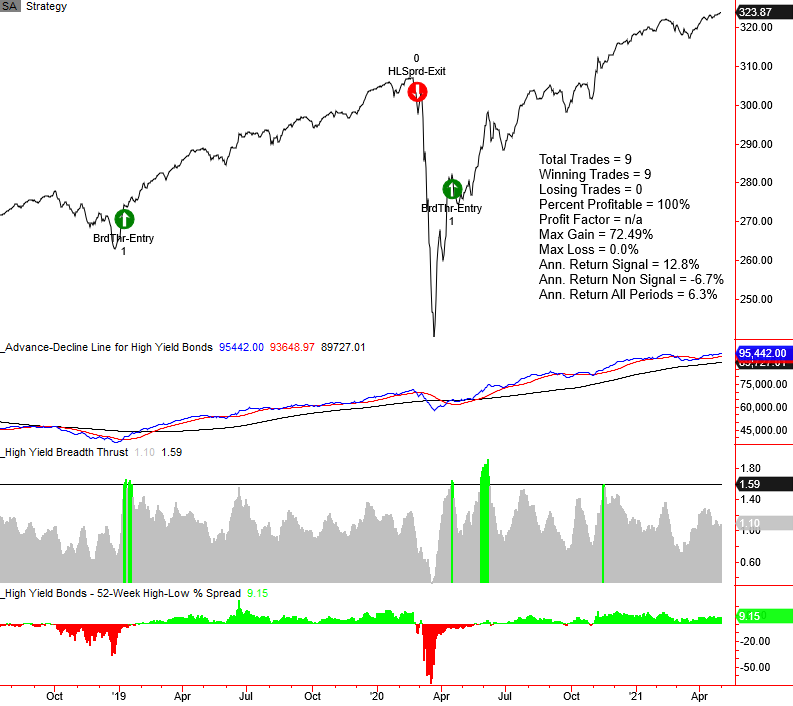
HIGH YIELD CHART
The high yield timing model registered a breadth thrust buy signal on 4/17/20 and continues to remain invested. The advance-decline line and new high-low spread indicators look constructive and nowhere near levels that would trigger a sell signal.
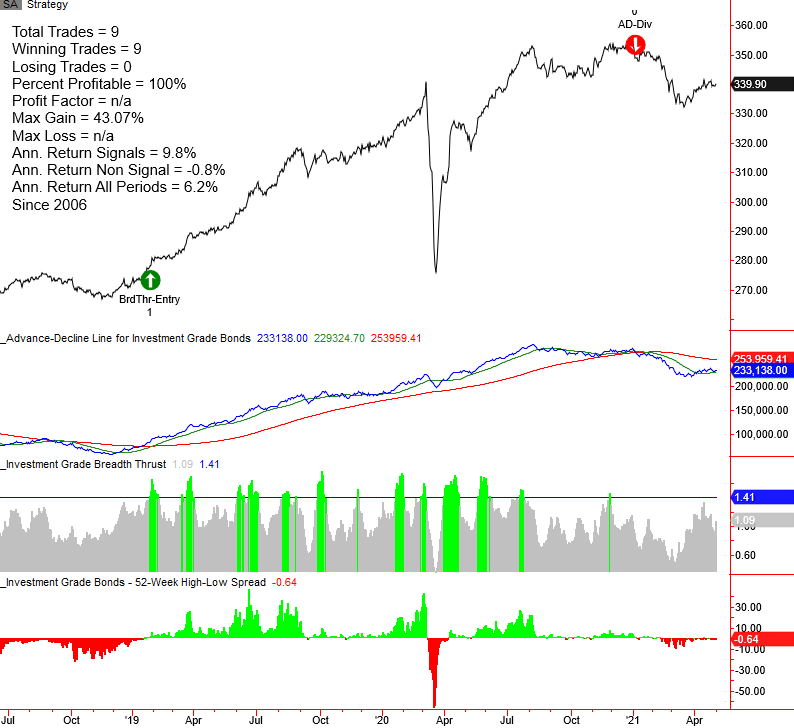
INVESTMENT GRADE CHART
The investment-grade timing model remains on a sell signal that triggered on 1/6/21. It's not uncommon to see investment-grade bond performance suffer in the face of rising treasury yields. For now, the increase in rates looks to be waning. However, I see nothing that suggests a new buy signal for investment-grade bonds is imminent.
Interestingly, the investment-grade timing model does a pretty good job with signals for long-term treasury bonds. Let's look at some examples.
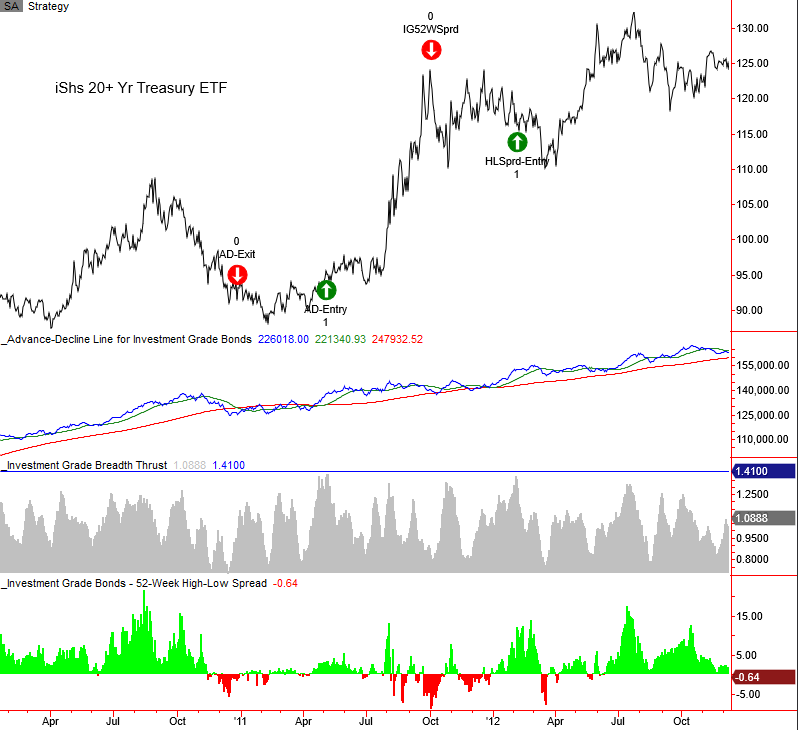
TREASURY CHART WITH IG TIMING MODEL
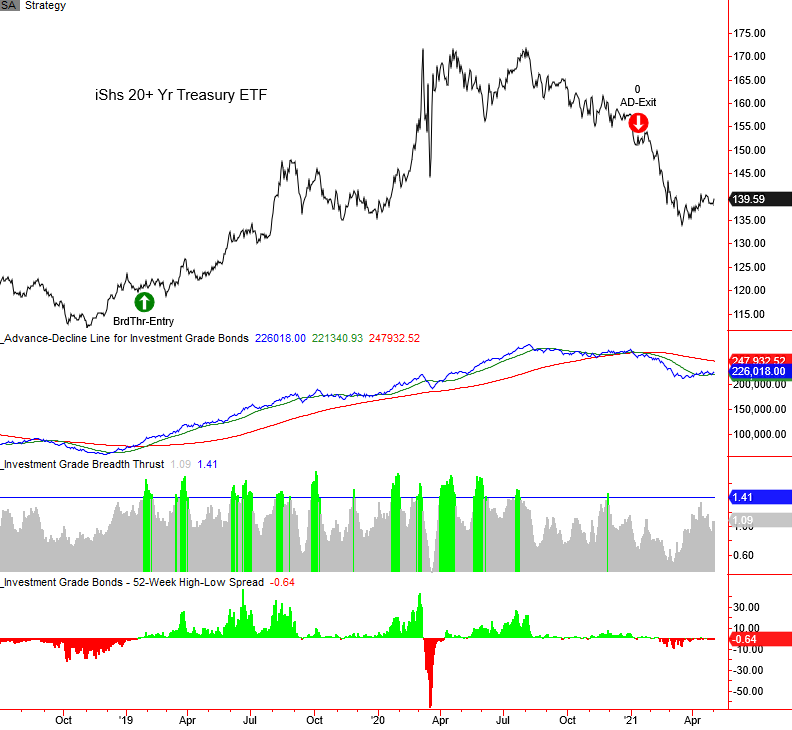
TREASURY CHART WITH IG TIMING MODEL
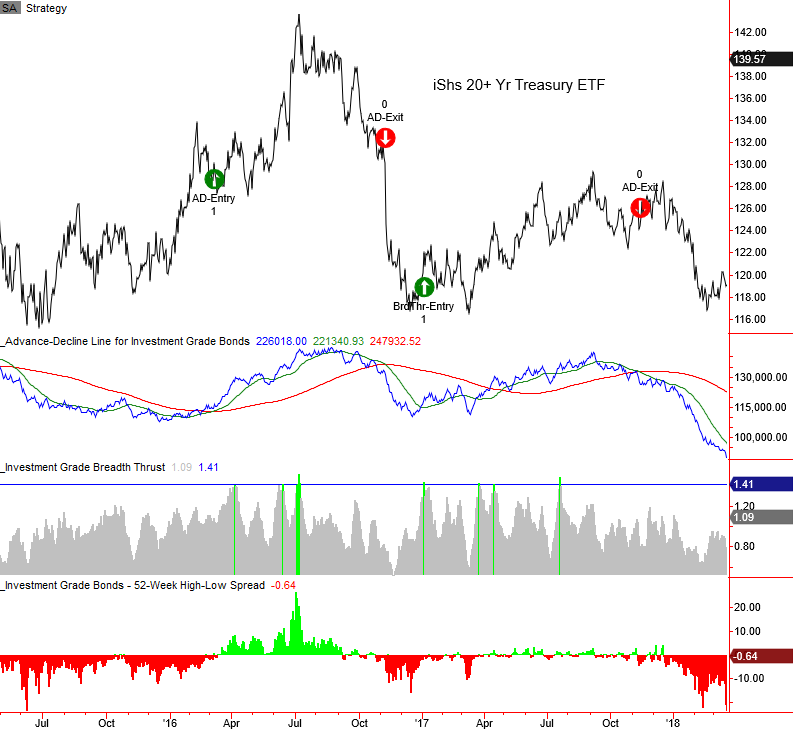
TREASURY CHART WITH IG TIMING MODEL