
Hedging Explodes; Average Days Before Bottoming

The most difficult part of any decline is determining if the decline was enough to satisfy what had been negative conditions prior to the losses, and whether the probabilities favor a v-shaped bounce or a more sustained testing phase.
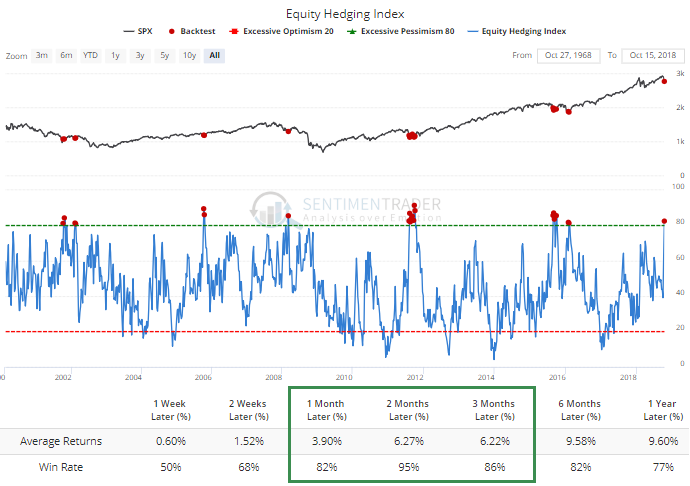
There were plenty of extremes generated last week, made even more apparent by data out over the weekend. A measure of hedging strategies we follow skyrocketed higher, and when that's happened in the past, stocks have almost risen in the months ahead almost without exception, even during bear markets.
So that's compelling, especially since I personally put a lot of weight on that particular indicator.
The studies we looked at in September that highlighted the dangerous conditions typically preceded losses of 3% - 8%, but over a period of 1-3 months. Not (essentially) a couple of days like last week. The decline met the typical magnitude, but not the typical length, and I don't know if that's an important distinction.
Something that has helped a lot in the past with junctures like this is looking at probabilities of a v-shaped bounce under similar conditions. Let's look at times when the S&P 500 had been at a 52-week high, then within four weeks fell to at least a 3-month low.
The table below shows every occurrence since 1928, along with how long it took to form at least a 1-month low and 3-month low.
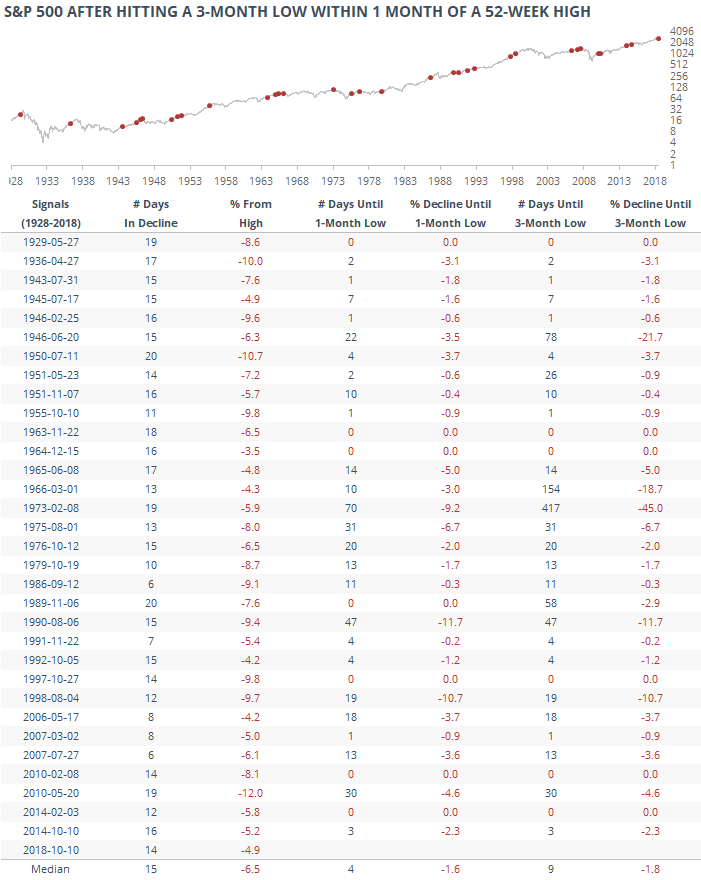
We can see that our current decline, lasting 14 sessions and losing 5% (when it first hit a 3-month low on October 10), is about in line with the median.
On average, it took the S&P another 4 days and 1.6% loss before it hit what would be its lowest point over the next month. And it took about twice that long before it formed a bottom for the next 3 months. Very often, the same day that formed the 1-month low was the same as the 3-month low, suggesting that most of these bottoms were more medium-term in nature as opposed to just dead-cat bounces.
Almost 40% of the time, these were v-shaped bottoms, roughly defined as the S&P bottoming within the next 2 days. That's a pretty high probability. And the downside was relatively limited, with some exceptions like '98 and '90.
In the 1970s, it took stocks a long time to find a temporary floor. If we exclude that one decade, then the median number of days before a 3-month low dropped to only 4 sessions.
The positives are starting to pile up. I personally am pretty conservative and don't like to make big moves unless I see overwhelming evidence one way or the other. I wouldn't quite say we're there now on the bullish side but it's moving quickly that way. Even if we're on the cusp of a larger trend change into a bear market, we're nearing a point now where we would usually see a multi-week or longer bounce of 3%-5%.