Data &
Technology
Research
Reports
Report Solutions
Reports Library
Actionable
Strategies
Free
Resources
Simple Backtest Calculator
Simple Seasonality Calculator
The Kelly Criterion Calculator
Sentiment Geo Map
Public Research Reports
Free Webinar
Pricing
Company
About
Meet Our Team
In the News
Testimonials
Client Success Stories
Contact
Log inLoginSign up
< BACK TO ALL REPORTS

Health care stocks haven't done this since January

Jason Goepfert
2020-11-06
More than 30% of health care stocks surged to a 52-week high, the most since January.

Health care stocks were some of the biggest beneficiaries of Wednesday's post-election relief rally. As a sector, they outperformed even highflying tech shares.

As a result, more than 30% of them broke out to fresh 52-week highs, among the biggest thrusts in years.

Percentage of health care stocks at 52-week high

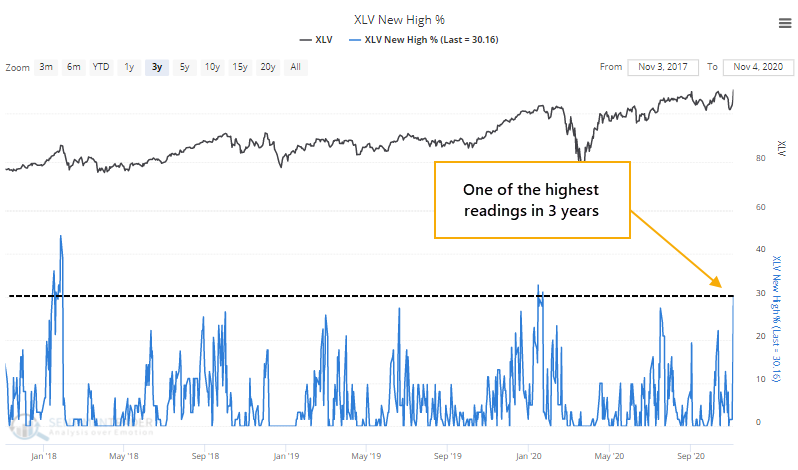
With some sectors, a surge in new highs tends to be a good sign of positive momentum, with consistently positive forward returns. Those tend to be higher-beta sectors. In more defensive sectors, we typically see weaker returns in the shorter-term after big thrusts. That was modestly the case for health care.

One of the relatively odd aspects of the surge in new highs is that there wasn't a concurrent surge in the percentage of them that also moved above their 200-day moving averages. Even after Wednesday's jump, fewer than 80% of them were in long-term uptrends. When that happens, the sector fared worse in the shorter-term.


What else is happening

These are topics we explored in our most recent research. For immediate access with no obligation, sign up for a 30-day free trial now.

  • What happens when there is a surge in new highs among health care stocks
  • And what happens when the surge is met by muted participation
  • Seasonality and insider buying interest in health care stocks
  • Value stocks have underperformed growth by nearly the widest spread in 30 years

Stat Box

The Dow Industrials rallied more than 1% for 4 consecutive sessions through Thursday. Going back to 1896, a total of 124 years, the index managed only 19 other streaks like this. Its most consistent performance was over the next 2 months, when it gained 15 times and lost ground 4 times.

Sentiment from other perspectives

We don't necessarily agree with everything posted here - some of our work might directly contradict it - but it's often worth knowing what others are watching.

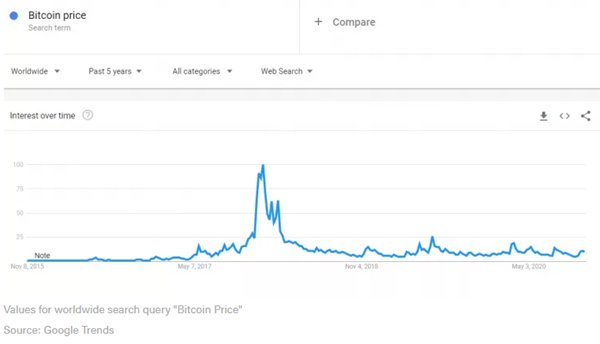
1. Not much sign of FOMO among bitcoin traders - Coinbase

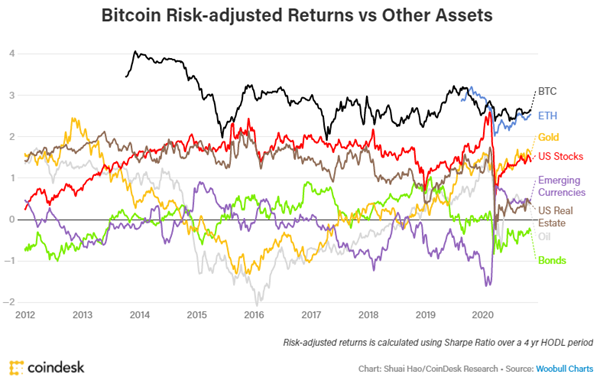
2. Even though it has the highest risk-adjusted return of any market - Coindesk

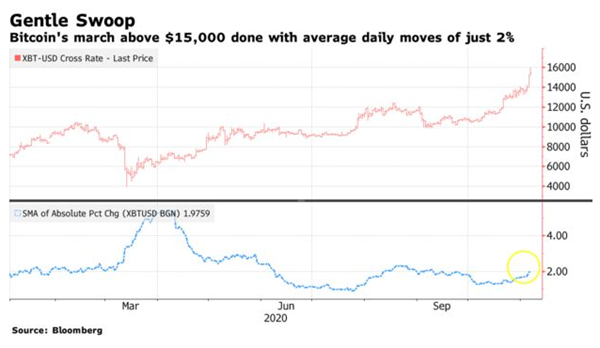
3. It's also rallying with smaller daily gains, not usually the sign of a euphoric market - Bloomberg

DATA &
TECHnologies
IndicatorEdge
‍
BackTestEdge
‍
Other Tools
‍
DataEdge API
RESEARCH
reports
Research Solution
‍
Reports Library
‍
actionable
Strategies
Trading Strategies
‍
Smart Stock Scanner
‍
FREE
RESOUrCES
Simple Backtest
Calculator
Simple Seasonality
Calculator
The Kelly Criterion
Calculator
Sentiment Geo Map
‍
Public Research Reports
‍
Free Webinar
COMPANY
‍
About
‍
Meet our Team
‍
In the News
‍
Testimonials
‍
Client Success Stories
Pricing
Bundle pricing
‍
Announcements
‍
FAQ
© 2024 Sundial Capital Research Inc. All rights reserved.
Setsail Marketing
TermsPrivacyAffiliate Program
Risk Disclosure: Futures and forex trading contains substantial risk and is not for every investor. An investor could potentially lose all or more than the initial investment. Risk capital is money that can be lost without jeopardizing ones’ financial security or life style. Only risk capital should be used for trading and only those with sufficient risk capital should consider trading. Past performance is not necessarily indicative of future results.

Hypothetical Performance Disclosure: Hypothetical performance results have many inherent limitations, some of which are described below. No representation is being made that any account will or is likely to achieve profits or losses similar to those shown; in fact, there are frequently sharp differences between hypothetical performance results and the actual results subsequently achieved by any particular trading program. One of the limitations of hypothetical performance results is that they are generally prepared with the benefit of hindsight. In addition, hypothetical trading does not involve financial risk, and no hypothetical trading record can completely account for the impact of financial risk of actual trading. for example, the ability to withstand losses or to adhere to a particular trading program in spite of trading losses are material points which can also adversely affect actual trading results. There are numerous other factors related to the markets in general or to the implementation of any specific trading program which cannot be fully accounted for in the preparation of hypothetical performance results and all which can adversely affect trading results.

Testimonial Disclosure: Testimonials appearing on this website may not be representative of other clients or customers and is not a guarantee of future performance or success.