Data &
Technology
Research
Reports
Report Solutions
Reports Library
Actionable
Strategies
Free
Resources
Simple Backtest Calculator
Simple Seasonality Calculator
The Kelly Criterion Calculator
Sentiment Geo Map
Public Research Reports
Free Webinar
Pricing
Company
About
Meet Our Team
In the News
Testimonials
Client Success Stories
Contact
Log inLoginSign up
< BACK TO ALL REPORTS

Half Of Nasdaq Stocks Are In Bear Markets

Jason Goepfert
2020-02-07
Half of the stocks on the Nasdaq are in bear markets, and nearly 70% are in corrections. The S&P 500 hasn't had a 7% drawdown in a year.

Big winners

Big tech stocks dominating the Nasdaq 100 have driven that index to more than a 5% gain over and above the broader Nasdaq Composite over the past year. That’s the widest spread in years. Similar bouts of big-tech dominance preceded some short-term weakness but that’s about it.

A bigger potential concern is that while those two indexes are hitting new highs, many stocks within them are not.

The latest round of fresh highs in the Nasdaq is coming despite more than half the stocks on the exchange being more than 20% off their 52-week high

Nasdaq stocks in corrections and bear markets

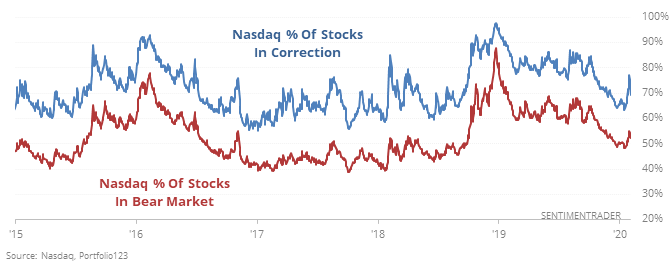
This has preceded some trouble in the past. Over the past 15 years, there was a total of 53 dates when the Composite closed at a 52-week high but more than 50% of stocks were in bear markets and more than 65% in corrections. Returns over the next 3 months were well below random for the Nasdaq and (especially) the S&P 500.
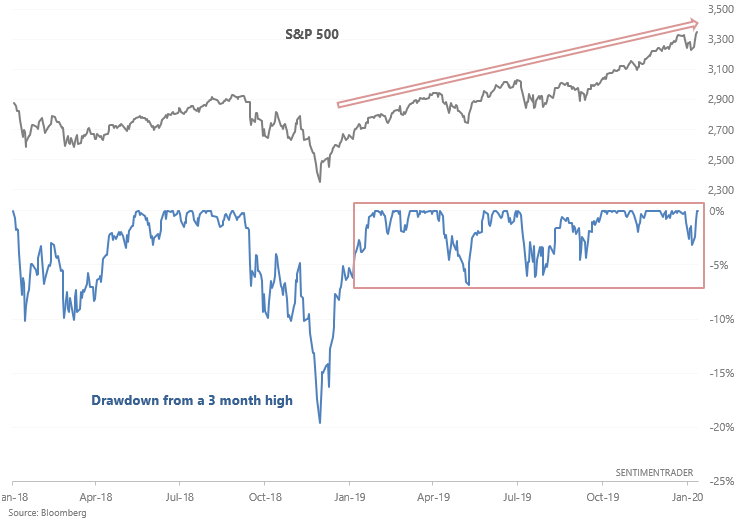

Shallow drawdowns

After a meltdown in late-2018, the U.S. stock market has trended higher without a correction from 2019-present. At its worst, the S&P fell -7% in mid-2019. For now at least it seems that the S&P's drawdowns have become shallower and shallower.

S&P 500 drawdown from 3 month high

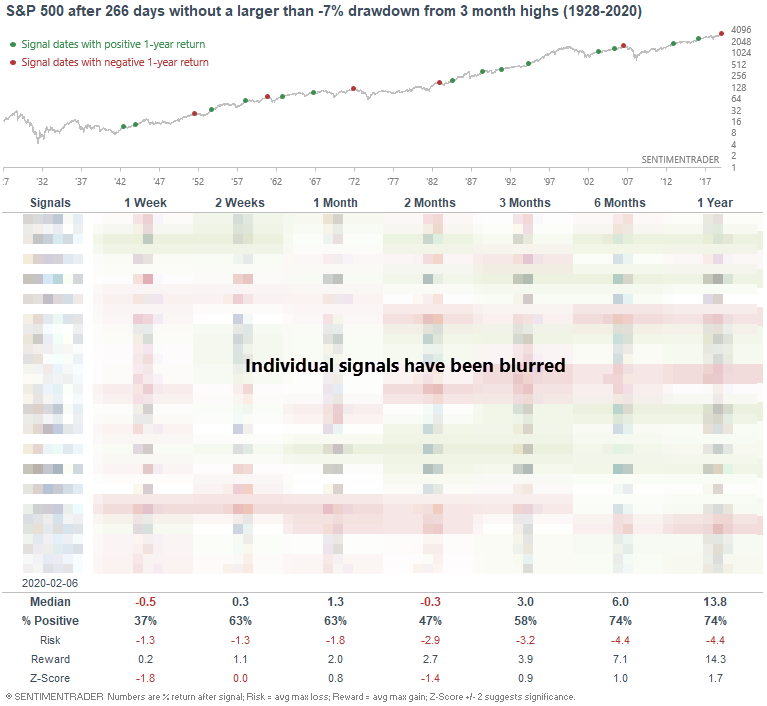
How long can this continue?

To date, the S&P has gone more than a year without a greater than -7% drawdown from a 3 month high. While it went more than 3 years without doing so (!) in the early 1990s, the current streak ranks among the largest since 1928.

By the time it lasted this long, the S&P was typically ready for some rest, sporting a poor risk/reward ratio over the next three months.

S&P long time between drawdowns

This is an abridged version of our recent reports and notes. For immediate access with no obligation, sign up for a 30-day free trial now.

We also looked at:

  • What happens when the Nasdaq 100 outperforms the Nasdaq Composite by so much over a year
  • Economic surprises in the U.S. and China are the highest in nearly 2 years
  • Earnings estimates on the Dow are turning negative
  • German manufacturing orders are plunging
  • Big tech stocks in the Nasdaq 100 have rallied most of the past 24 weeks
  • What happens when investors turned negative on bonds
DATA &
TECHnologies
IndicatorEdge
‍
BackTestEdge
‍
Other Tools
‍
DataEdge API
RESEARCH
reports
Research Solution
‍
Reports Library
‍
actionable
Strategies
Trading Strategies
‍
Smart Stock Scanner
‍
FREE
RESOUrCES
Simple Backtest
Calculator
Simple Seasonality
Calculator
The Kelly Criterion
Calculator
Sentiment Geo Map
‍
Public Research Reports
‍
Free Webinar
COMPANY
‍
About
‍
Meet our Team
‍
In the News
‍
Testimonials
‍
Client Success Stories
Pricing
Bundle pricing
‍
Announcements
‍
FAQ
© 2024 Sundial Capital Research Inc. All rights reserved.
Setsail Marketing
TermsPrivacyAffiliate Program
Risk Disclosure: Futures and forex trading contains substantial risk and is not for every investor. An investor could potentially lose all or more than the initial investment. Risk capital is money that can be lost without jeopardizing ones’ financial security or life style. Only risk capital should be used for trading and only those with sufficient risk capital should consider trading. Past performance is not necessarily indicative of future results.

Hypothetical Performance Disclosure: Hypothetical performance results have many inherent limitations, some of which are described below. No representation is being made that any account will or is likely to achieve profits or losses similar to those shown; in fact, there are frequently sharp differences between hypothetical performance results and the actual results subsequently achieved by any particular trading program. One of the limitations of hypothetical performance results is that they are generally prepared with the benefit of hindsight. In addition, hypothetical trading does not involve financial risk, and no hypothetical trading record can completely account for the impact of financial risk of actual trading. for example, the ability to withstand losses or to adhere to a particular trading program in spite of trading losses are material points which can also adversely affect actual trading results. There are numerous other factors related to the markets in general or to the implementation of any specific trading program which cannot be fully accounted for in the preparation of hypothetical performance results and all which can adversely affect trading results.

Testimonial Disclosure: Testimonials appearing on this website may not be representative of other clients or customers and is not a guarantee of future performance or success.