
Growth vs. Value Deviation From Trend Signal

Jason and I have shared several notes in the last few months that have suggested that one should favor value-oriented sectors in a portfolio. Whenever I tilt my portfolio toward a style, factor, or theme, I'm constantly reviewing the latest data to assess if the backdrop has changed.
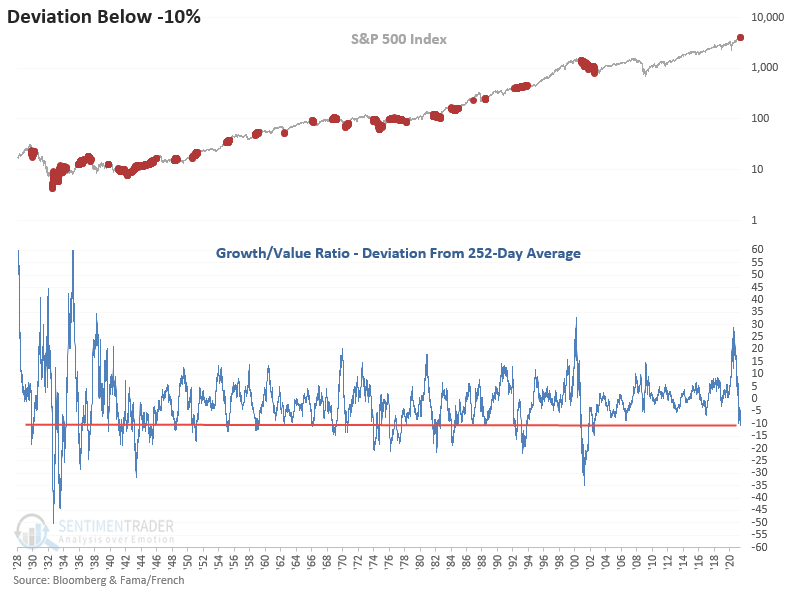
This past week, the 1-year deviation from the trend for the growth/value relative ratio indicator crossed below -10%. One has to go back almost two decades to find the last reading below this level.
Let's conduct the following study to assess the potential outcome for growth and value now that the ratio has fallen 10% below the 1-year average. While the current signal is coming from one of the highest starting points in history, I will adjust the code to capture more instances. I will use a swing of +10% to -10% to identify signals.
HISTORICAL CHART
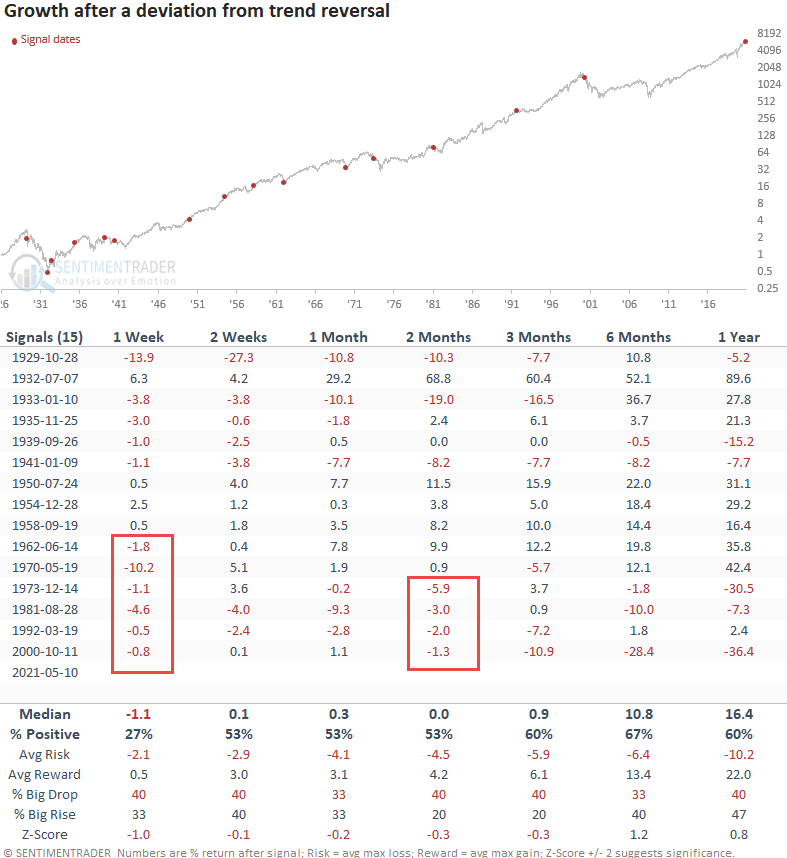
HOW THE SIGNALS PERFORMED - GROWTH
Growth returns are somewhat weak, especially in the short term. I would also add that the more recent signals have been unfavorable.
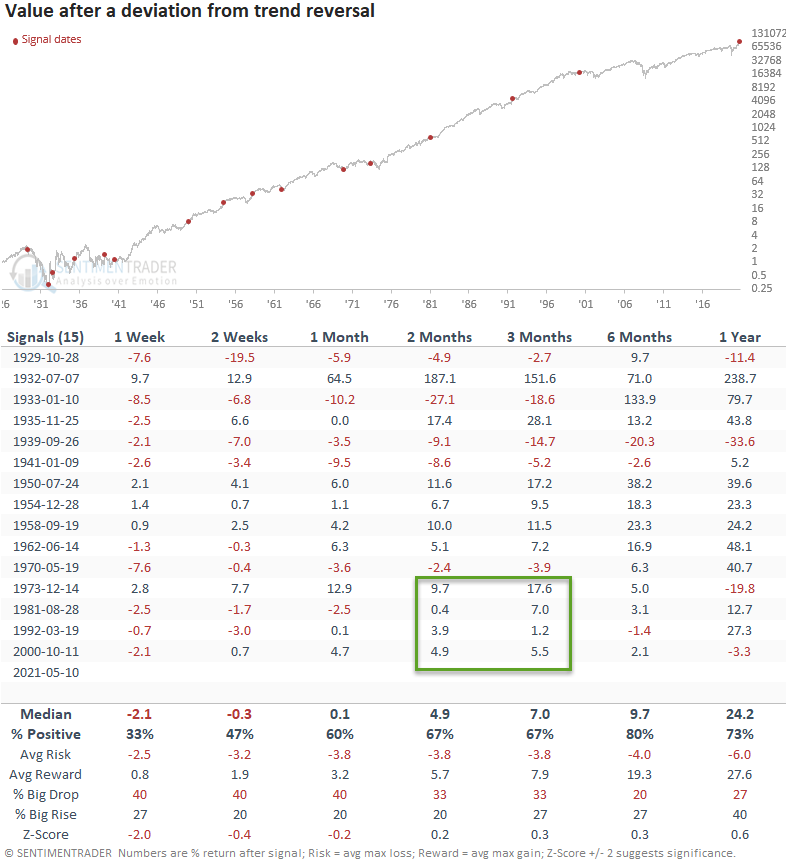
HOW THE SIGNALS PERFORMED - VALUE
The short-term results look weak. I suspect this reflects that value has outperformed of late, and it's taking a break. The intermediate to long-term numbers look better. I would also add that the 2-3 month timeframe returns have been good since 1973.
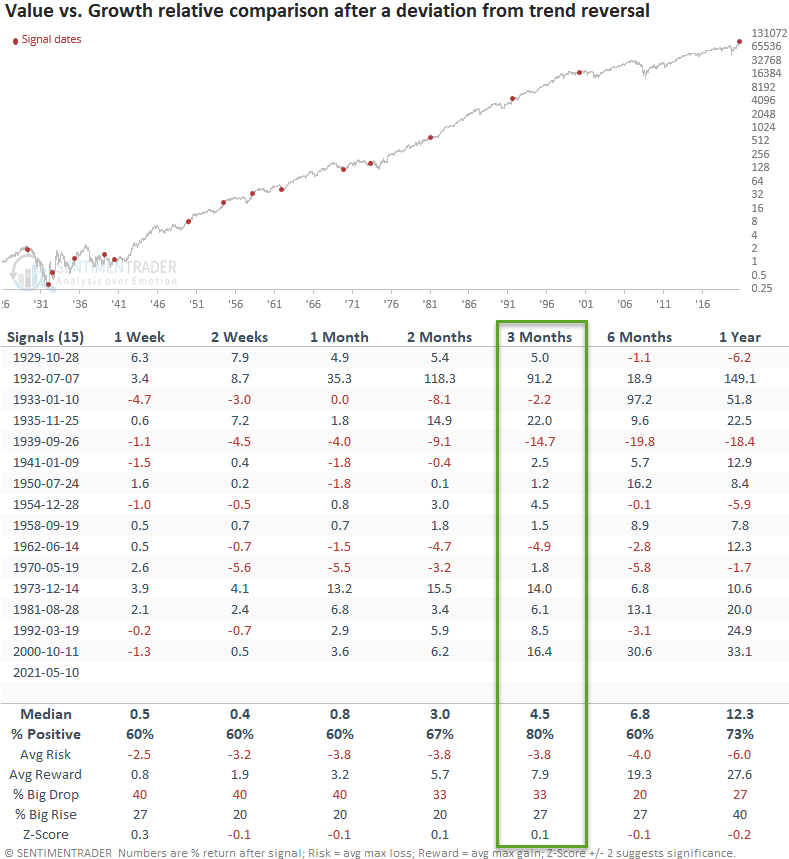
HOW THE SIGNALS PERFORMED - VALUE VERSUS GROWTH RELATIVE
Value looks good on a relative basis versus growth, especially in the 3-month timeframe.
Let's take the study one step further and identify all instances when the deviation from trend indicator crosses below -10% and then falls further to cross below -20%.
When we isolate instances when the indicator falls below -20%, the study identified six occurrences.
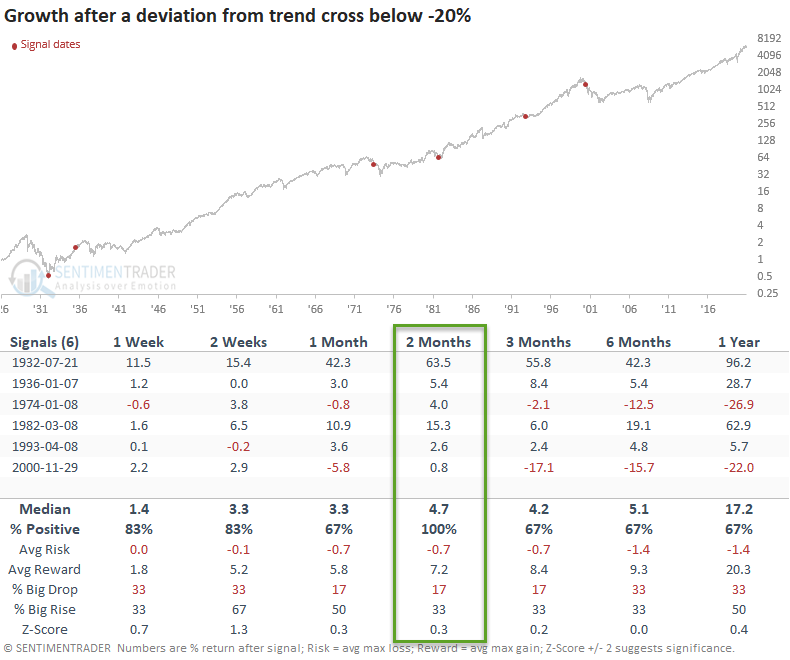
HOW THE SIGNALS PERFORMED - GROWTH
The results for growth look good, with a perfect record in the 2-month timeframe.
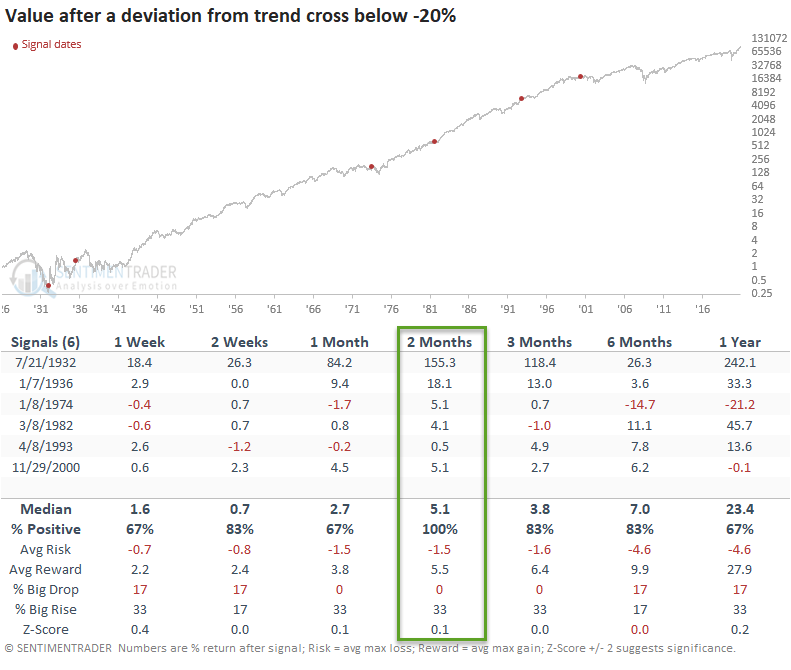
HOW THE SIGNALS PERFORMED - VALUE
The results for value look good, with a perfect record in the 2-month timeframe.
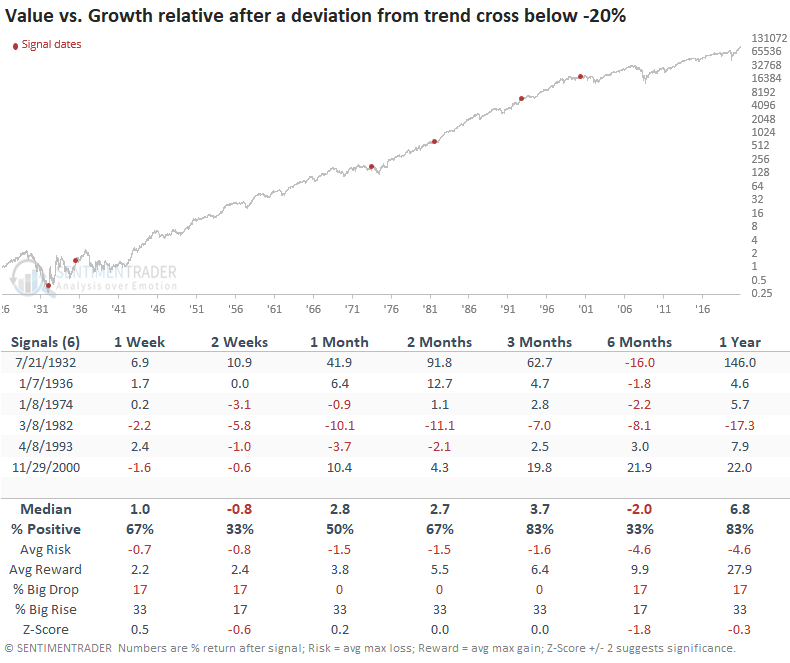
HOW THE SIGNALS PERFORMED - VALUE VERSUS GROWTH RELATIVE
A value tilt looks favorable on a 1-year basis except for the 1982 instance.
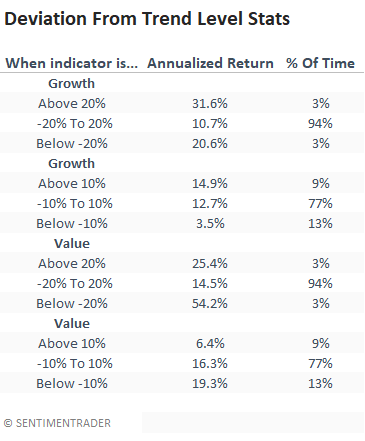
WHEN TO FAVOR GROWTH OR VALUE
The weight-of-the-evidence continues to favor value-oriented sectors. Until proven otherwise, I would stay the course.