
Gridlock For A Disliked President

Most of the hand-wringing over today's U.S. midterm elections is just noise. Even the best pollsters have only a shaky grasp on potential results, and even then, trying to guess what that means for markets is foolhardy. The reaction following the 2016 election is the exception proving that rule.
There may be a handful of folks with a good handle on institutional order flow given various potential election outcomes, but they're not telling me and certainly not CNBC or any other media.
Despite the futility, I've been asked a few times to show what happened after other midterms when the president was disliked and voters rejected him by triggering a loss of seats in Congress for his party, preferably when Congress was mixed or a majority were not of the president's party.
Gridlock, in other words.
There aren't many examples. Going back to 1950, the following table shows every time the president's approval rating was below 50 by late October, the midterm election triggered a loss of seats for the president's party, and Congress was either mixed or in direct opposition to his party.
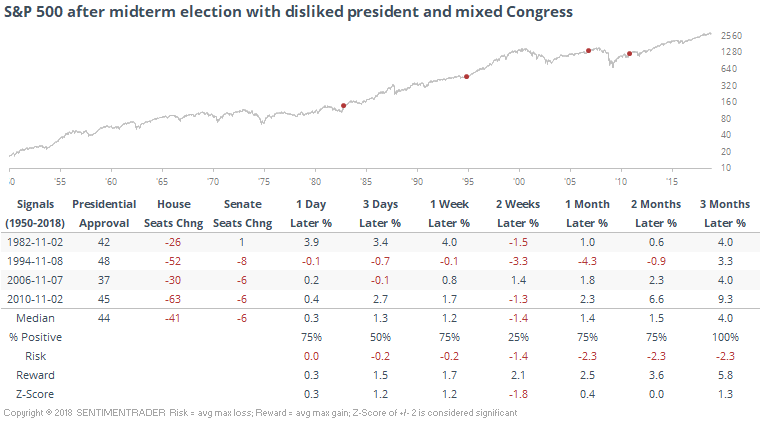
We can see that returns were mixed, and somewhat volatile. A week after the election, the S&P was higher every time but once (with one tiny loss) but two weeks later, down 3 of 4 times. But again by 2-3 months later, good returns.
Take that for what it's worth, which probably isn't much.