
Gold's trend teeters on the edge

The long-term uptrend in gold is teetering on the edge.
Over the past 40+ years, it has had a debatable tendency to fall further when its 50-day moving average crosses below the 200-day average after a prolonged period above. A couple of times it led to weakness, a couple to rebounds. Generally, though, a gold bull would rather see the moving averages rising than falling, obviously.
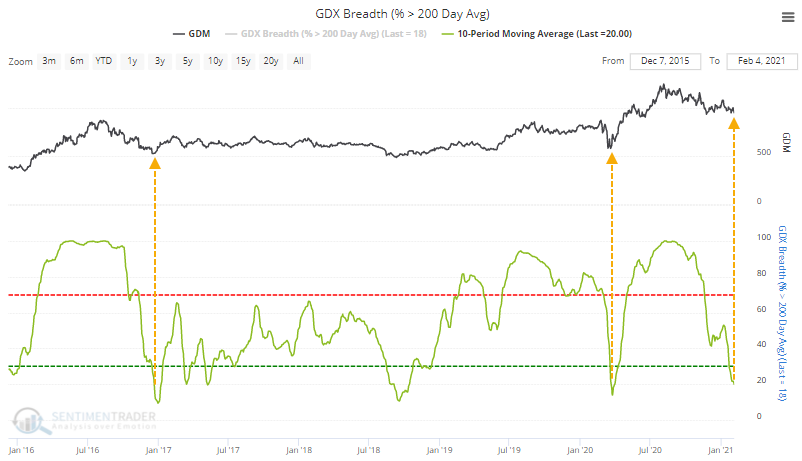
When it comes to the companies tasked with pulling the metal out of the ground, they've gotten hit hard enough that on an average day over the past 2 weeks, only 20% of them were holding above their 200-day moving averages.
Putting this into context, it comes on the heels of a period when more than 85% of them were above their long-term average. They have cycled like this 2 other times in recent years, both preceding imminent bottoms as noted last week.
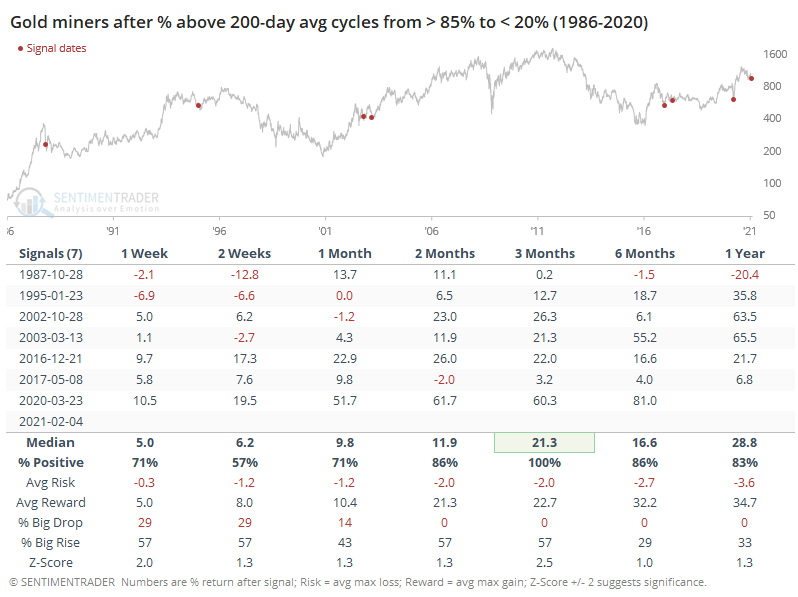
Going back as far as we can, this kind of behavior has resulted in rebounds over the next 3 months, with a very good risk/reward ratio. The group isn't just oversold (or getting there, anyway), they've consolidated after a major upward momentum burst. That's the kind of thing that hasn't rolled over easily in the past.
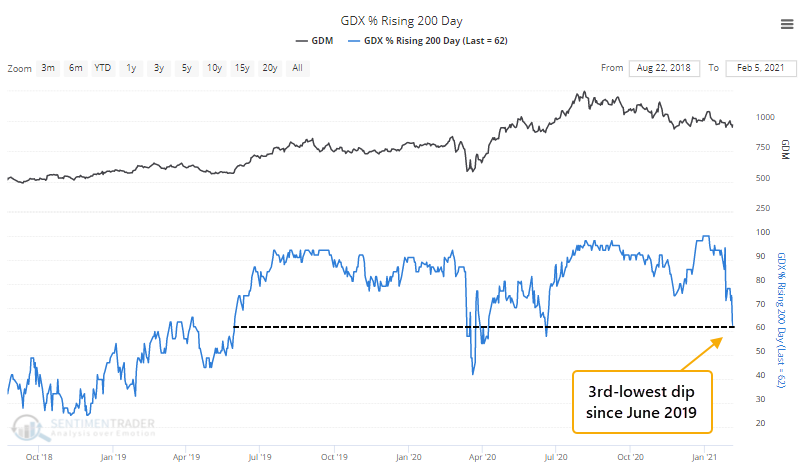
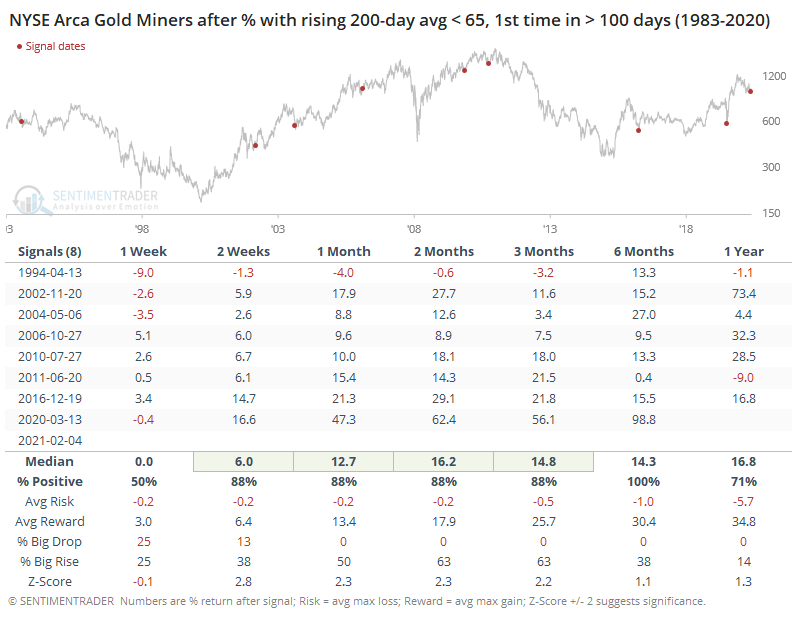
Because more and more miners are falling below their 200-day averages and staying there, the number of those stocks with a rising 200-day moving average is also falling quickly. After all of them had been in strong uptrends, now fewer than 65% of them are.
These trends had held for a long time. It's the first time in more than 150 days that fewer than 65% of gold miners have rising 200-day averages, ending one of the longest streaks in nearly 40 years.
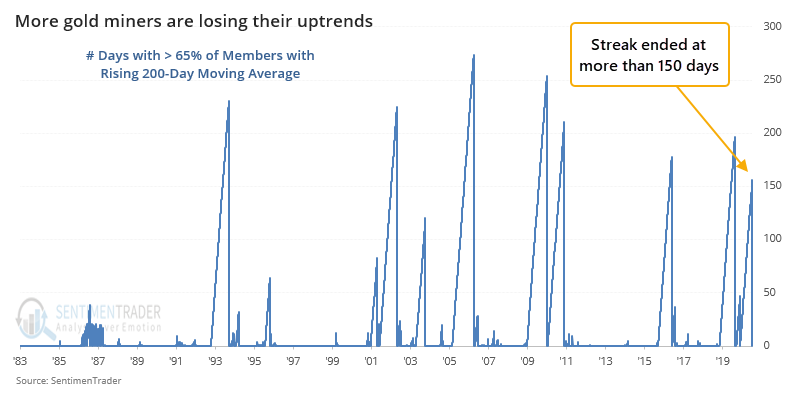
Like we saw above, when a long streak of positive momentum ends, miners have tended to rally afterward. Over the past 20 years, they've had a perfect record of regaining their upside momentum.
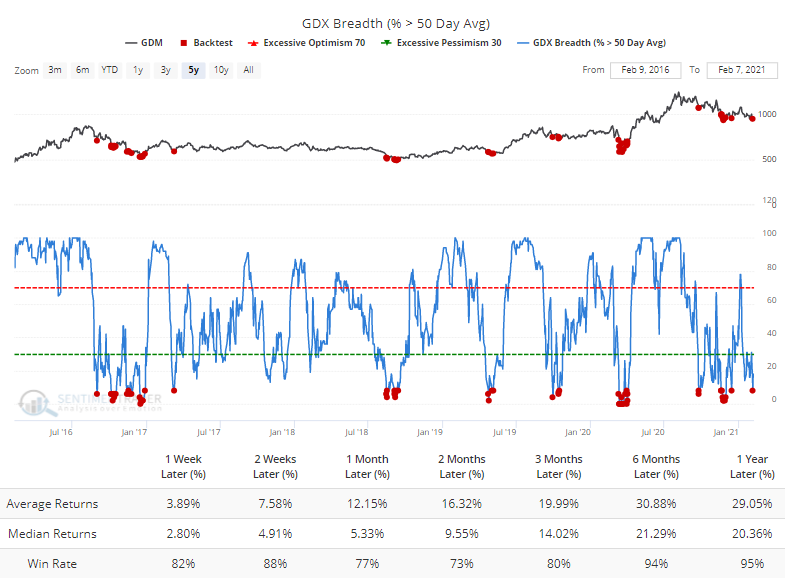
Shorter-term trends have to fall before longer-term ones do, so the recent pullback has led to fewer than 10% of miners holding above their medium-term 50-day moving averages. Over the past 5 years, this has been about "it" for the pullbacks according to the Backtest Engine.
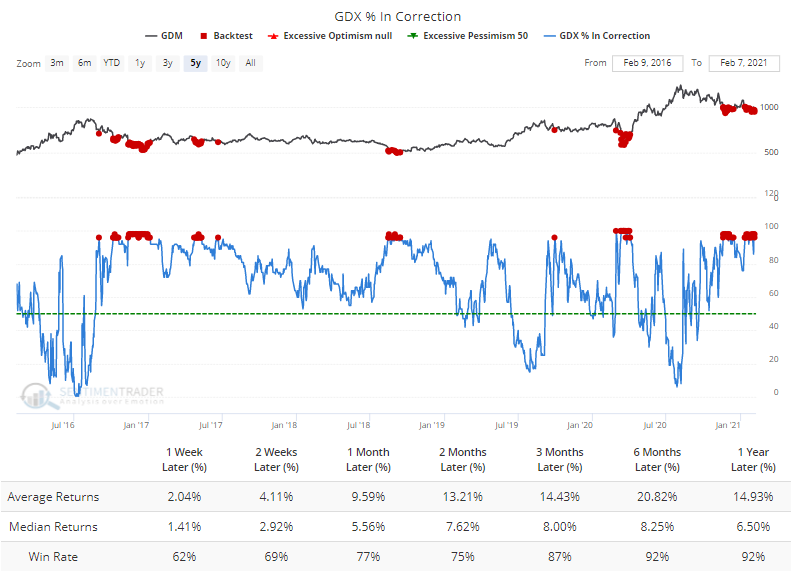
It's been enough selling pressure to push more than 95% of miners more than 10% below their 52-week highs.
Or even further - more than 80% of them are more than 20% below their highs, the common definition of a bear market.
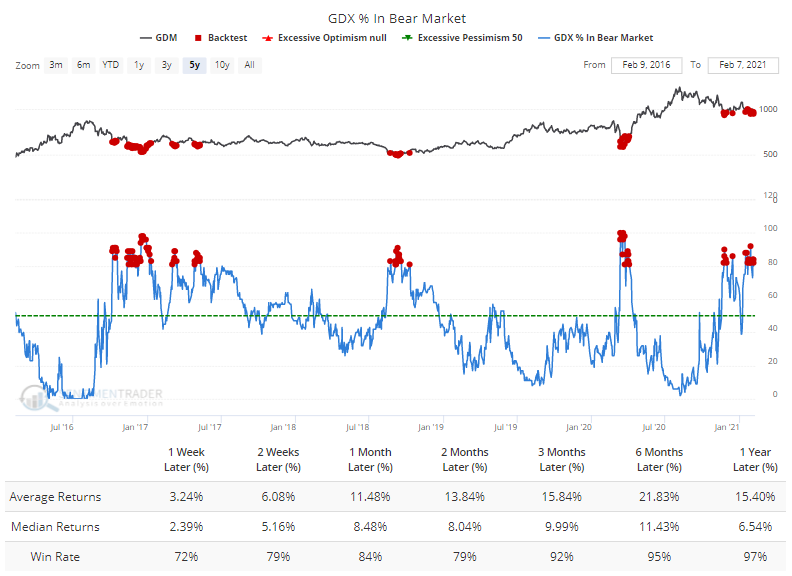
During the most recent bull run of the past 5 years, this type of behavior has occurred almost exclusively as miners were forming their lows. If they don't rebound quickly now, then it will suggest that the last 5 years isn't a good template, and that the bull market may have ended.
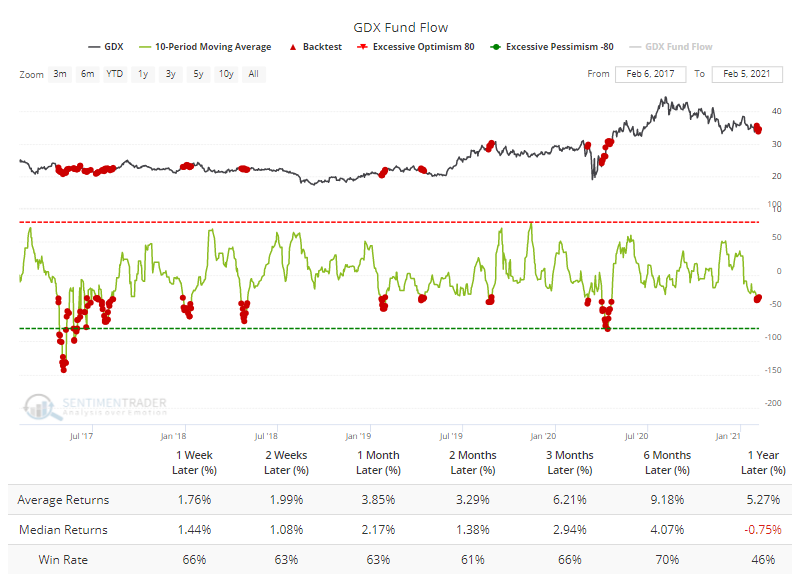
All the selling pressure has caused quick-fingered ETF traders to leave funds like GDX.
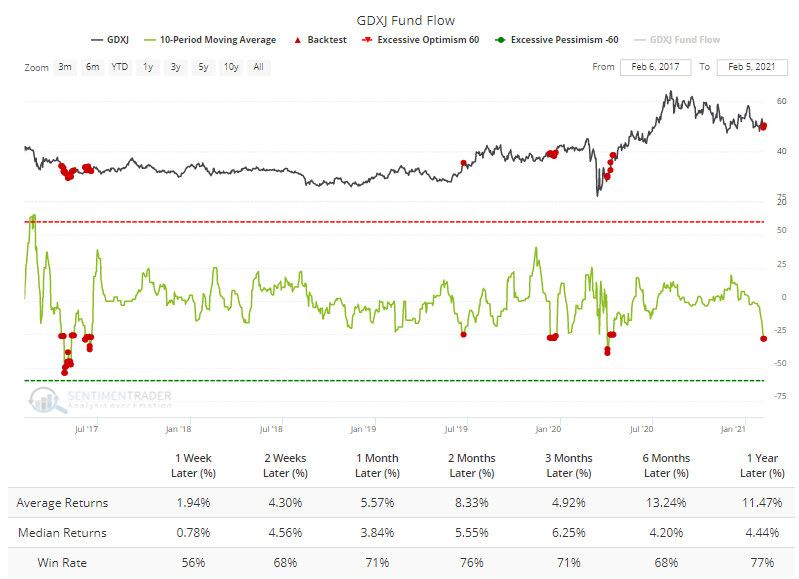
The riskier junior gold miners have also seen outflows, with an average of more than $25 million per day leaving GDXJ.
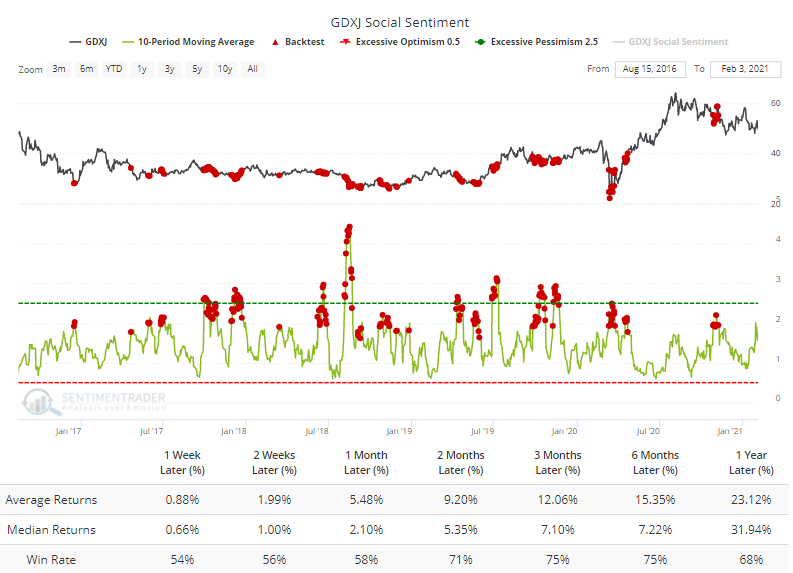
The Twitter universe has turned sour on these companies, with nearly 2 negative messages for each positive one.
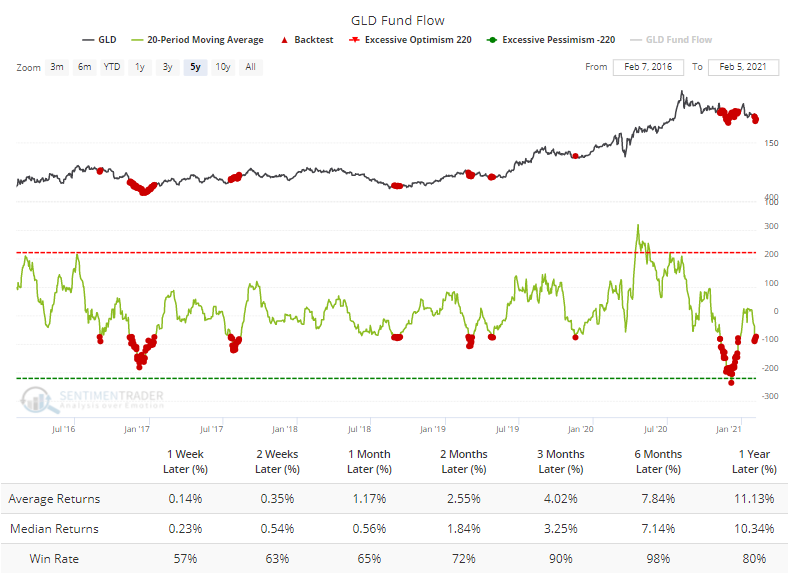
For gold itself, the GLD fund has also seen some relatively heavy outflows.
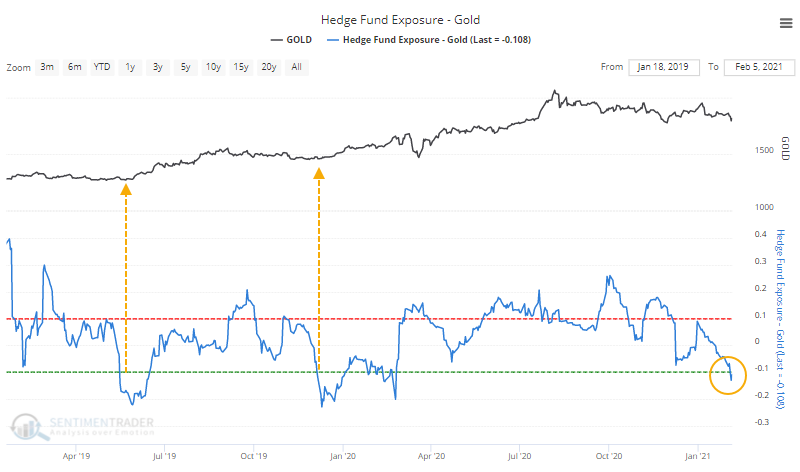
And hedge funds appear to be selling as well.
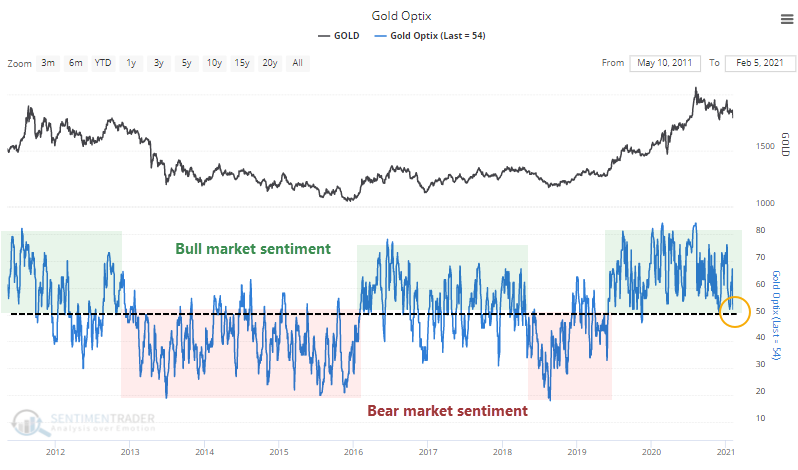
All of this has helped to push the Optimism Index for gold down to one of its lowest levels in the past couple of years.
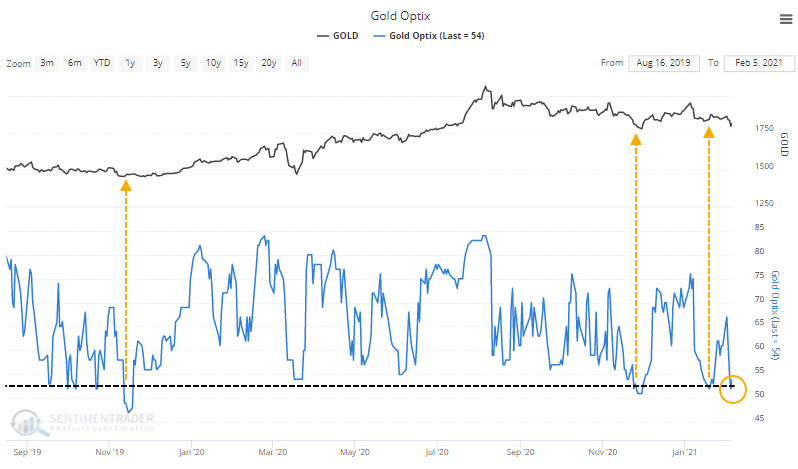
This is about the level where sentiment bottoms out during bull markets. During bear markets, it gets much, mure more pessimistic.
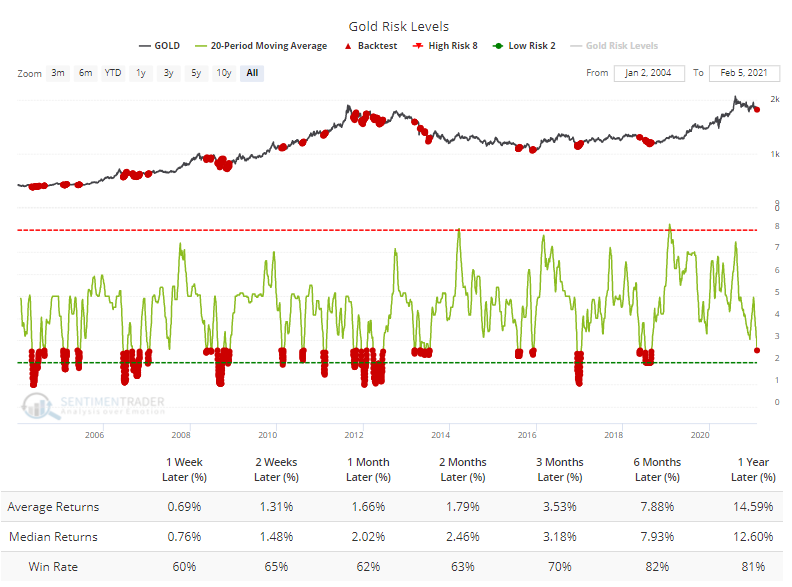
Because of the low sentiment readings during what had been a healthy trend, the Risk Level has been very low for more than 20 days.
One of the biggest knocks against a potential rebound in gold is that "smart money" commercial hedgers are heavily short. They take the other side of speculators' positions, so it means that speculators are heavily long. Hedgers are now net short more than 55%, one of their biggest positions ever.
But we have to remember that hedgers are, you know, hedging by definition, which means they're likely heavily exposed to a rise in the price of gold. It's definitely a better sign when hedgers go net long a commodity, but we need to guard against automatically assuming that the opposite is true. That's one of the primary reasons we created the Backtest Engine, as it shows facts versus assumptions.
And the fact is that after other weeks when hedgers were net short more than 55% of open interest in gold futures, gold rallied most of the time going forward because this occurred primarily during the last major bull market.
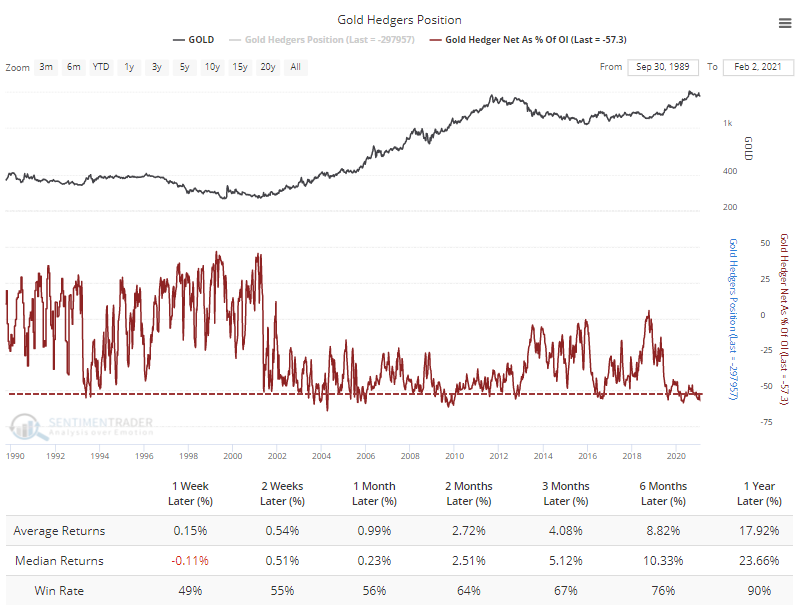
When they got this short in October 2012 and August 2016, gold quickly rolled over, so that's a warning. But they already got heavily short in August of 2019 during this latest cycle, and yet gold powered higher. That's more like the character of the mid-2000s than post-2012.
All of this suggests that if the regime of the past 5 years or so in gold is going to hold, then the metal, and its miners, should be forming a trough around the current level of pessimism. If they can only manage weak rallies that are quickly sold, and form continual lower lows, then the probability will rise dramatically that the bull run has ended.