
Gold's good year brings optimism

Last week, we saw that technology stocks were beating every other sector by more than 5% through about the mid-way part of the year. Tech isn't the only asset having a good half-year - gold is, too.
Through about the half-way point of 2020, gold has returned more than 16% and is at its highs for the year. Meanwhile, it suffered only a small drawdown from where it closed 2019.
Below, we can see all years when gold had the best risk/reward through this many sessions of a year.
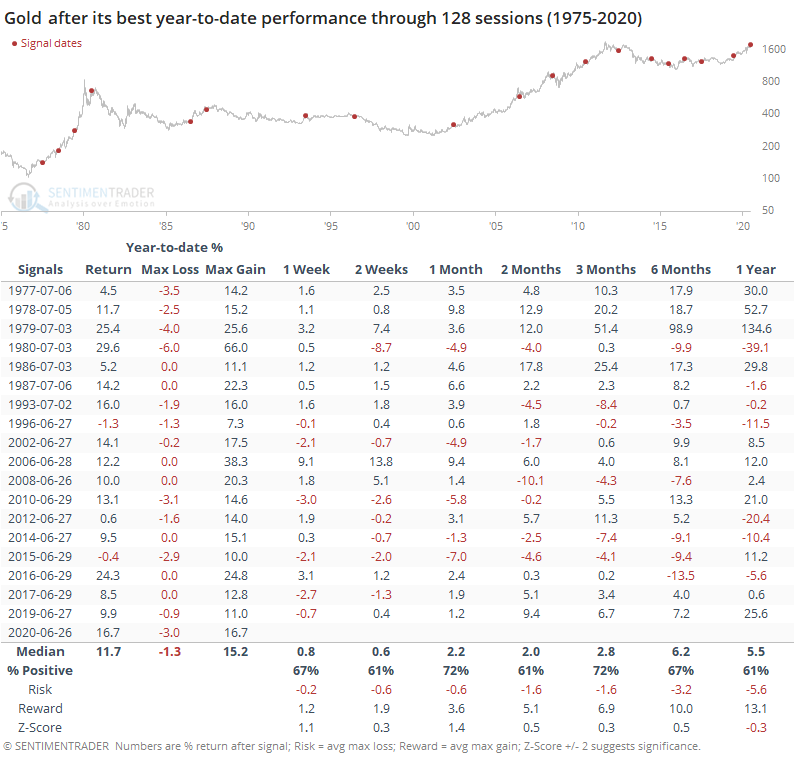
Momentum is a powerful thing, and when gold had good years, it tended to keep going. Over the next few months, gold tended to keep rallying, with only 4 out of the 18 years showing a substantial decline in the months ahead. It's not a very strong signal but looks to be a modest positive.
Contrast this to years when gold suffered its worst risk/reward through about the half-way point of a year.
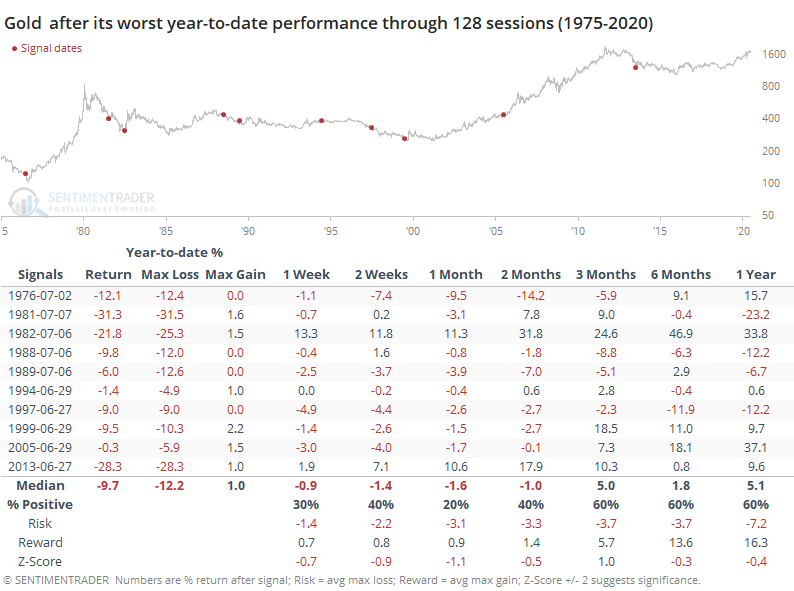
Its returns were much worse, with only two years (1982 and 2013) seeing the metal turn around significantly in the months ahead.
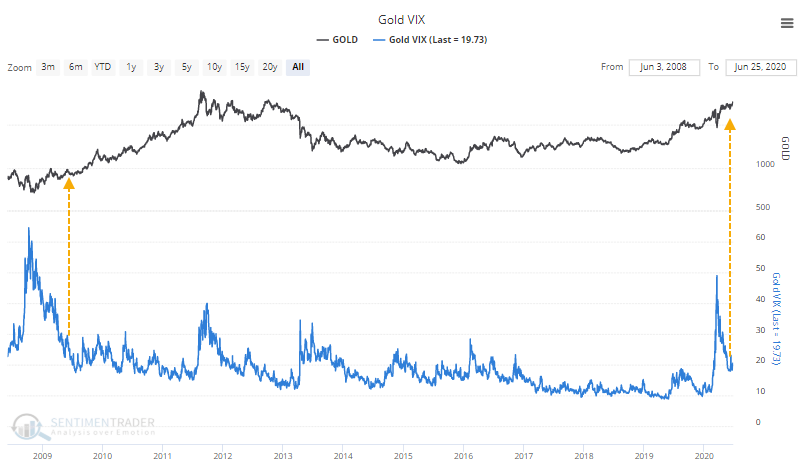
Implied volatility in gold spiked in March when it quickly tumbled along with almost everything else during the peak of the panic. It has since started to calm down. Implied volatility in commodities doesn't necessarily work like it does in stocks - it's just as likely to spike during rapid price rallies as declines. The only time gold's "VIX" spiked above 40 during a decline and then calmed down below 20 was in 2009.
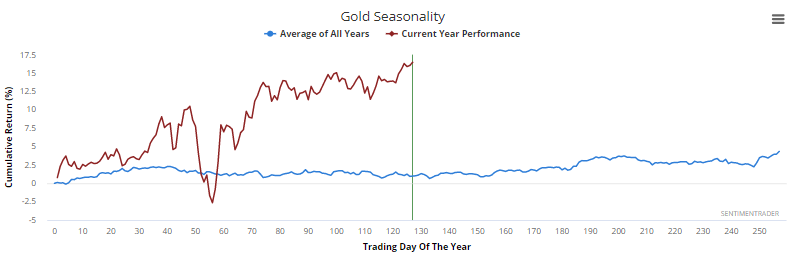
Gold's seasonal pattern has tended to show mediocre returns during the summer, with more "oomph" during the latter months.
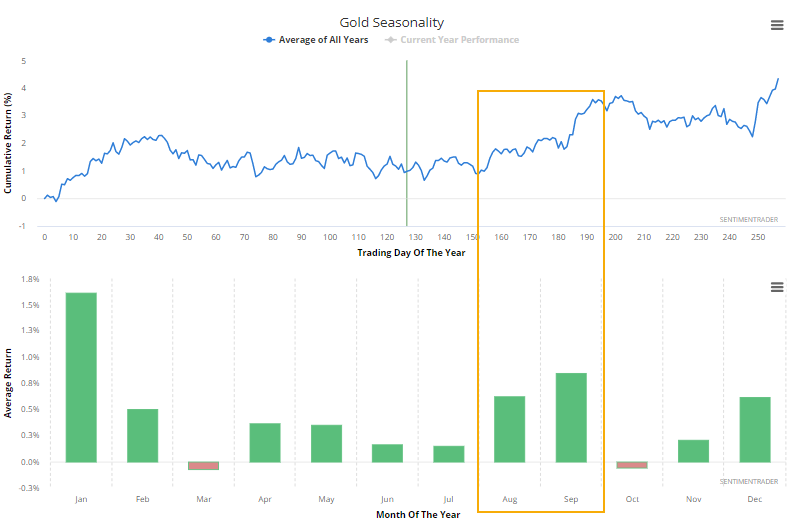
Its pattern in 2020 has somewhat followed the script in general, but clearly not in magnitude.
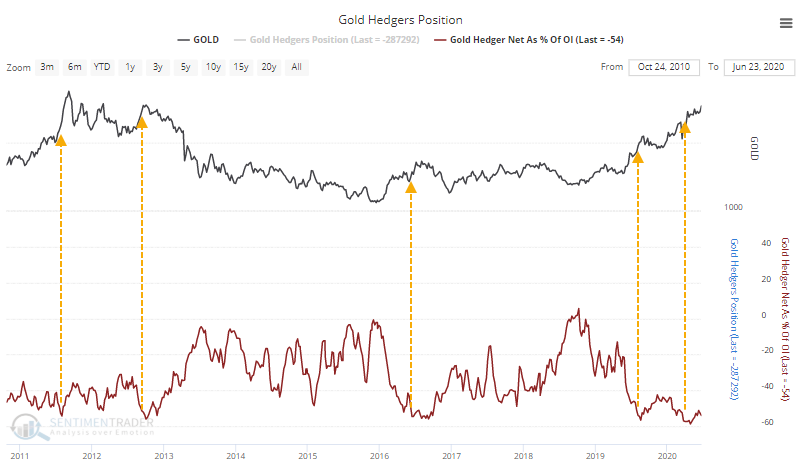
One concern is that "smart money" hedgers are betting against the metal, holding more than 50% of open interest net short, which means that speculators are heavily long. This has been an issue in recent years, but not so much historically. This is drastically different from the kind of sentiment we saw in August 2018 (here and here and here).
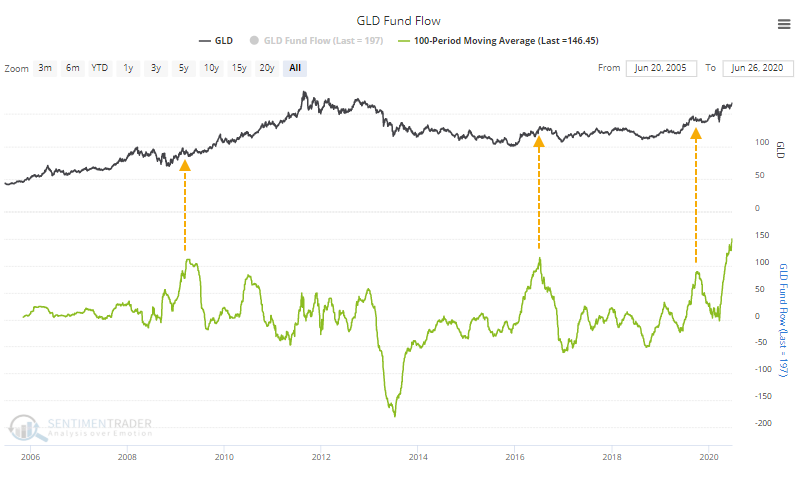
There have also been heavy flows into some gold funds like GLD. Over the past 100 days, it has averaged an inflow of nearly $150 million per day, a record high.
Traders who frequent the Rydex family of mutual funds have also come back to precious metals. Assets in that fund have doubled since early April and are back above $100 million. The Backtest Engine shows poor returns over the past 7 years when assets were this high, though with the caveat that assets were frequently 2-3 times higher than this during the mid-2000s run.
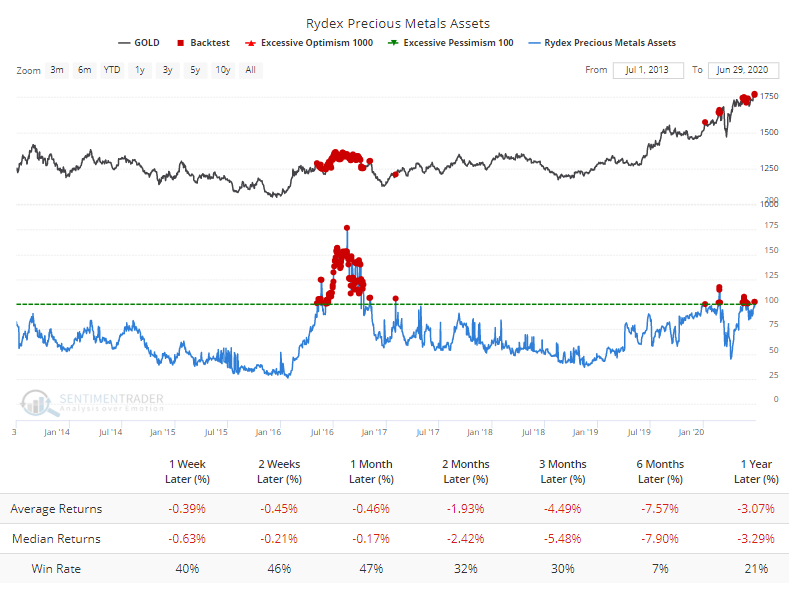
This kind of activity has pushed the Optimism Index for gold above 75. The Backtest Engine shows that gold's short- to medium-term returns have been flat when optimism is this high.
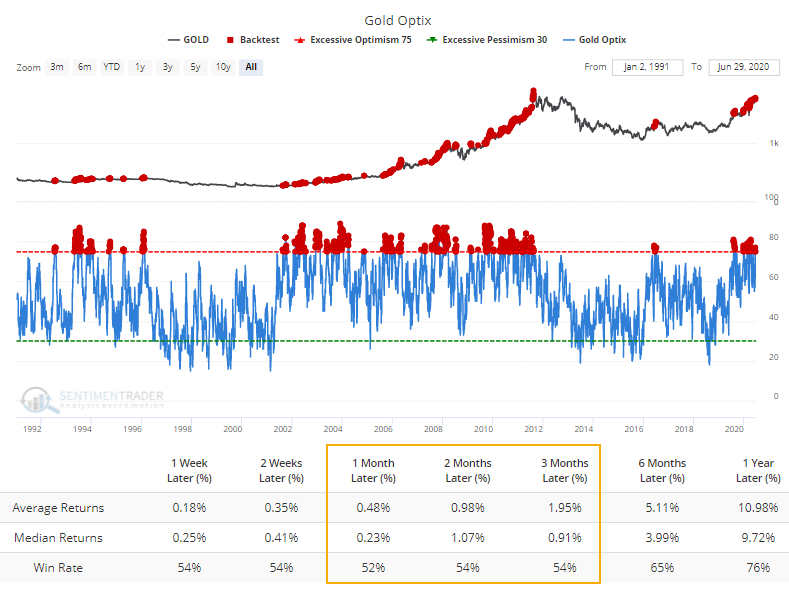
The fact that gold is still hitting new highs despite signs of high optimism earlier this year is a good sign. If gold can continue to hold ground despite high optimism, then it suggests a long-term positive market environment much like the mid-2000s.
The best risk/reward setups tend to occur during periods of truly extreme pessimism like late summer 2018, with the next-best being momentum market environments. We're definitely not seeing the former; we're potentially seeing the latter. There are some minor shorter-term negatives, so if those can calm down in the weeks ahead, then it should present a better risk/reward for the metal heading into the late summer.