Data &
Technology
Research
Reports
Report Solutions
Reports Library
Actionable
Strategies
Free
Resources
Simple Backtest Calculator
Simple Seasonality Calculator
The Kelly Criterion Calculator
Sentiment Geo Map
Public Research Reports
Free Webinar
Pricing
Company
About
Meet Our Team
In the News
Testimonials
Client Success Stories
Contact
Log inLoginSign up
< BACK TO ALL REPORTS

Gold miners' shining moment

Jason Goepfert
2020-07-29
Every gold mining stock is trading above its 50- and 200-day moving averages and a near-record percentage of them have hit a 52-week high at the same time.

Even as "everything" rallies, the biggest standout is gold. Whatever the reasons behind the move, it has been stunning.

The worry among some is that it's only speculative activity, as judged by the fact that bitcoin, dubbed the "new gold", has also started to spike. As the Daily Shot notes, the correlation between the two alternative stores of value has jumped. Past bouts of high correlation had a mixed record at suggesting that gold buyers were being too speculative.

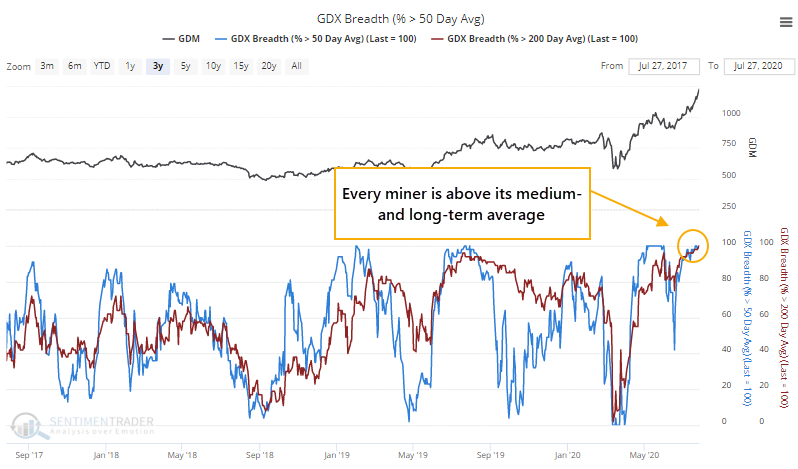
Because of the surge in the metal, gold mining companies have taken off as well. The NYSE Arca Gold Miners Index (GDM), the basis for popular exchange-traded funds like GDX, has skyrocketed 34% in just the past 30 days.

That has helped to push every gold mining stock above their 50- and 200-day moving averages, a feat rarely achieved. Almost all of them are even above their shortest-term averages, and a near-record percentage of them have ticked at a 52-week high. That's astoundingly widespread buying interest in this group.

Percentage of gold miners above 50 200 day moving average

Only one date showed a gain over the next couple of weeks, and that one ended up giving those gains back. All but one of the signals showed a loss between 1-3 months after these breadth surges since 1993.

These breadth measures on gold mining stocks is something unique to SentimenTrader, with data going back nearly 30 years, all available for testing in the Backtest Engine. The following are updated on a daily basis:

  • % of gold miners above their 10-day average
  • % of gold miners above their 50-day average
  • % of gold miners above their 200-day average
  • % of gold miners at 52-week high
  • % of gold miners at 52-week low
  • % of gold miners in a correction
  • % of gold miners in a bear market


This is an abridged version of our recent reports and notes. For immediate access with no obligation, sign up for a 30-day free trial now.

We also looked at:

  • A deeper look at breadth among gold mining stocks
  • A look at the correlation between gold and bitcoin
  • The past 3 months have seen an "everything rally" with big gains in stocks, bonds, commodities, and gold - what it's meant for each
  • Homebuilding stocks have had a record rally
  • What happens after silver's largest one-month gains
  • A near-record number of Chinese stocks are triggering technical sell signals
DATA &
TECHnologies
IndicatorEdge
‍
BackTestEdge
‍
Other Tools
‍
DataEdge API
RESEARCH
reports
Research Solution
‍
Reports Library
‍
actionable
Strategies
Trading Strategies
‍
Smart Stock Scanner
‍
FREE
RESOUrCES
Simple Backtest
Calculator
Simple Seasonality
Calculator
The Kelly Criterion
Calculator
Sentiment Geo Map
‍
Public Research Reports
‍
Free Webinar
COMPANY
‍
About
‍
Meet our Team
‍
In the News
‍
Testimonials
‍
Client Success Stories
Pricing
Bundle pricing
‍
Announcements
‍
FAQ
© 2024 Sundial Capital Research Inc. All rights reserved.
Setsail Marketing
TermsPrivacyAffiliate Program
Risk Disclosure: Futures and forex trading contains substantial risk and is not for every investor. An investor could potentially lose all or more than the initial investment. Risk capital is money that can be lost without jeopardizing ones’ financial security or life style. Only risk capital should be used for trading and only those with sufficient risk capital should consider trading. Past performance is not necessarily indicative of future results.

Hypothetical Performance Disclosure: Hypothetical performance results have many inherent limitations, some of which are described below. No representation is being made that any account will or is likely to achieve profits or losses similar to those shown; in fact, there are frequently sharp differences between hypothetical performance results and the actual results subsequently achieved by any particular trading program. One of the limitations of hypothetical performance results is that they are generally prepared with the benefit of hindsight. In addition, hypothetical trading does not involve financial risk, and no hypothetical trading record can completely account for the impact of financial risk of actual trading. for example, the ability to withstand losses or to adhere to a particular trading program in spite of trading losses are material points which can also adversely affect actual trading results. There are numerous other factors related to the markets in general or to the implementation of any specific trading program which cannot be fully accounted for in the preparation of hypothetical performance results and all which can adversely affect trading results.

Testimonial Disclosure: Testimonials appearing on this website may not be representative of other clients or customers and is not a guarantee of future performance or success.