
Gold miners pull the rug once again

Key points:
- Gold miners have pulled back significantly after their recent breakout, with most stocks down 20%
- The sector has not responded well to such pullbacks other than short-term rebounds
- With almost all of the stocks off at least 10% from their highs, miners have much to prove
A familiar pattern for gold bugs
A little over a month ago, we looked at what was then one of the hottest trades: gold and gold mining stocks. Gold miners are stocks that have tended to react poorly to extremely positive momentum and participation, and unfortunately for gold bugs, this proved true yet again.
The popular GDX fund got clipped for about -20% in the weeks since then, though they enjoyed a large rebound on Monday. Before that bounce, a lot of damage had been done.
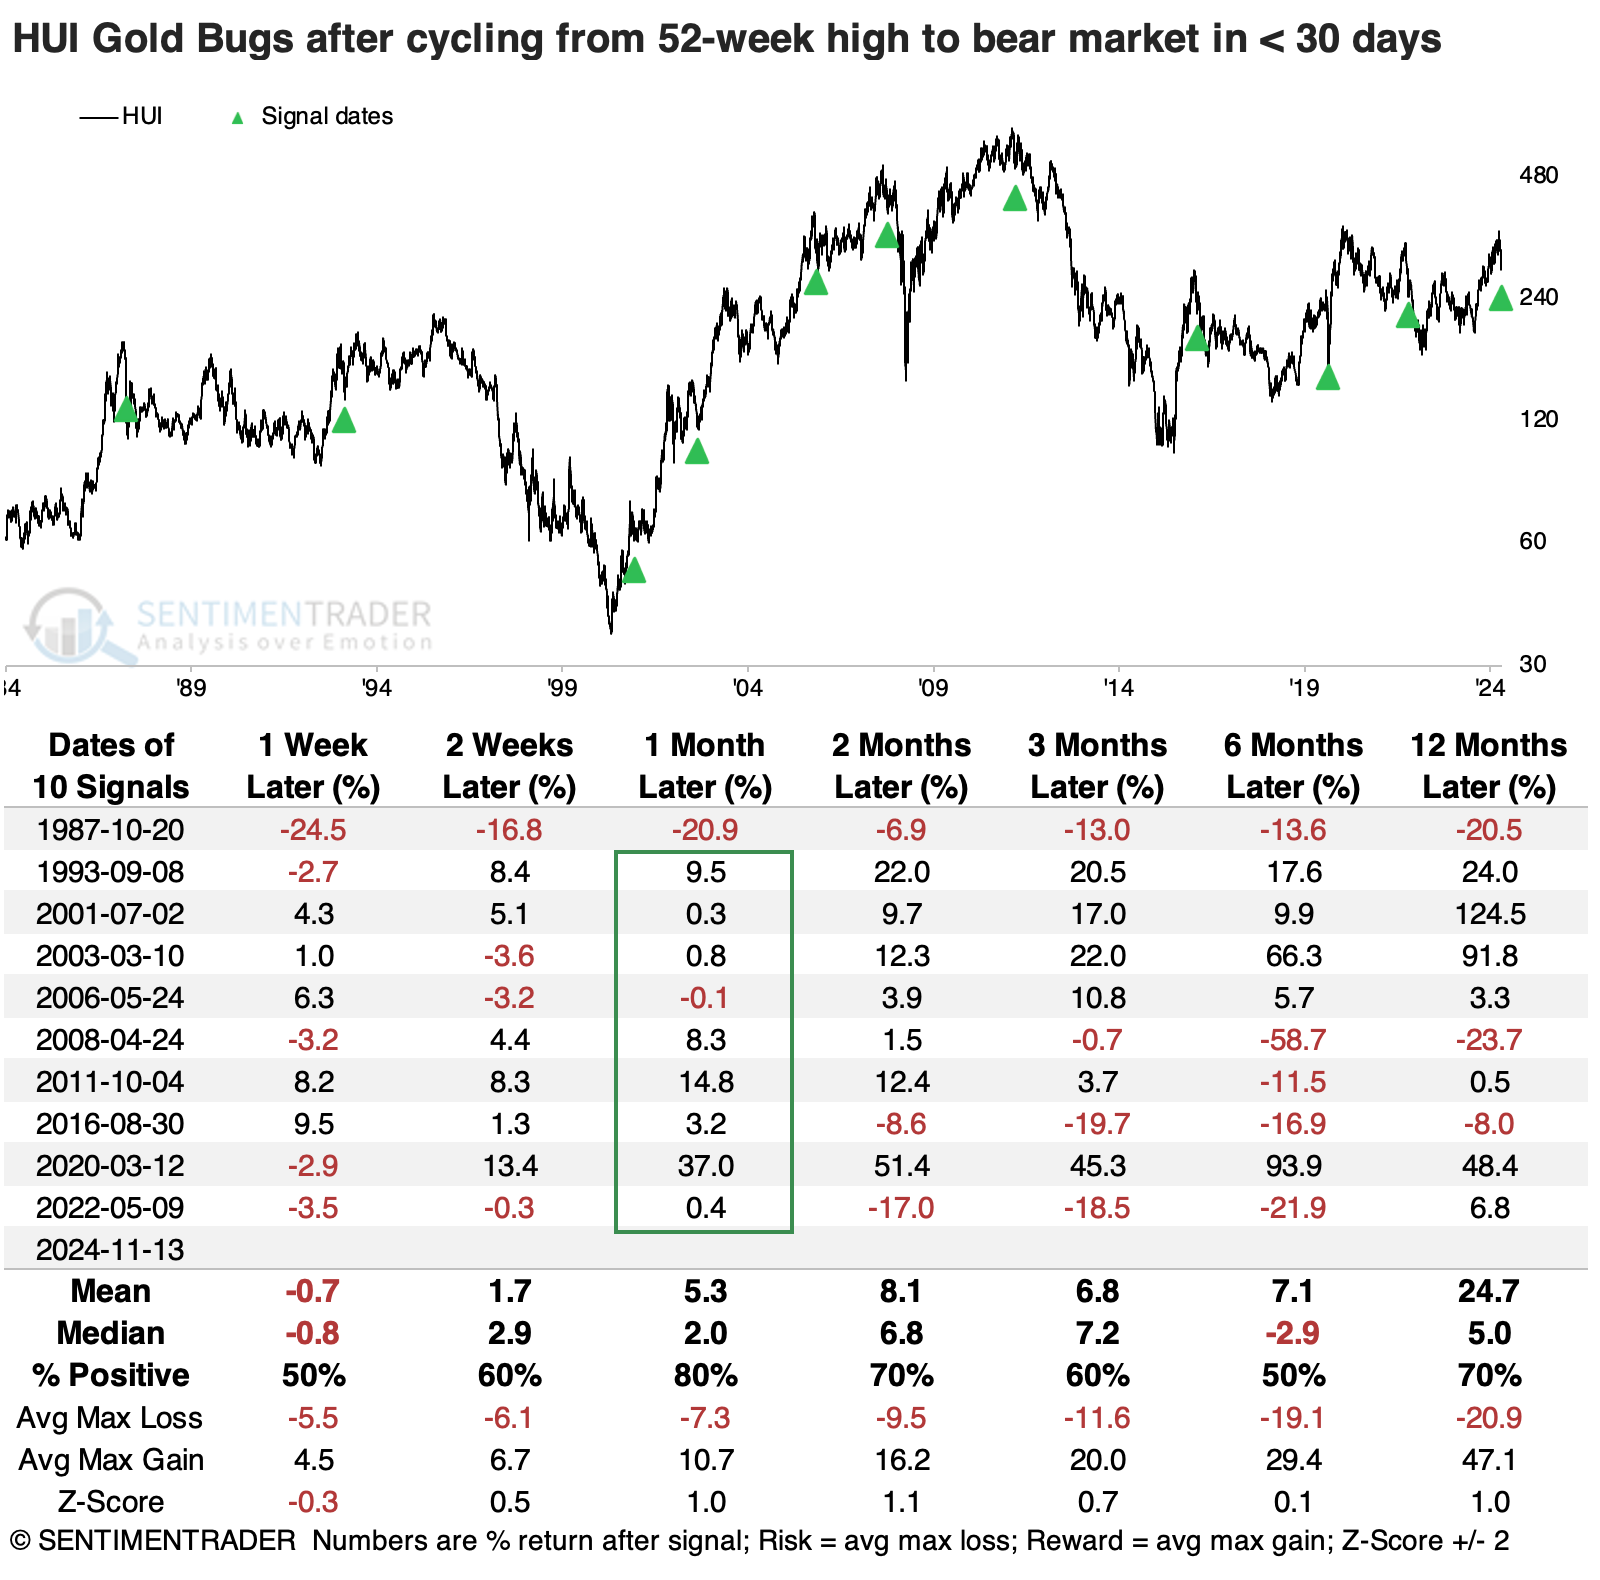
At least gold bugs can hang onto the idea that quick bear markets haven't been a bad time to bet on a rebound. The table below shows other times when they cycled from a 52-week high to -20% (rounded) within 30 days. Over the next month, there was only one notable loss. Several of them rolled over quickly after that.
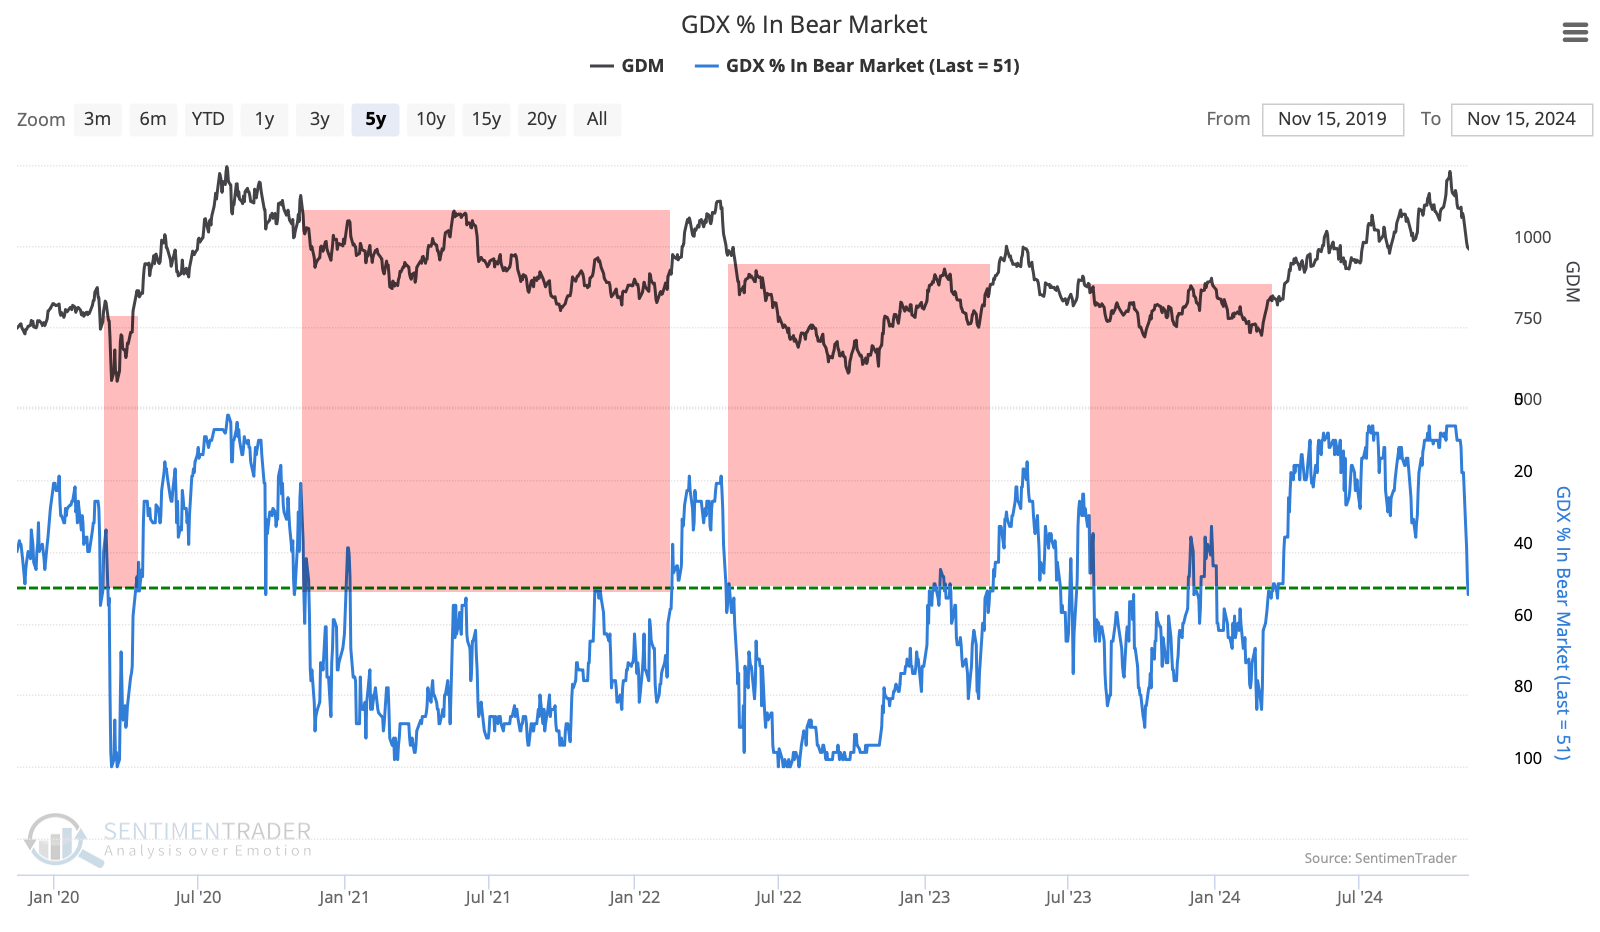
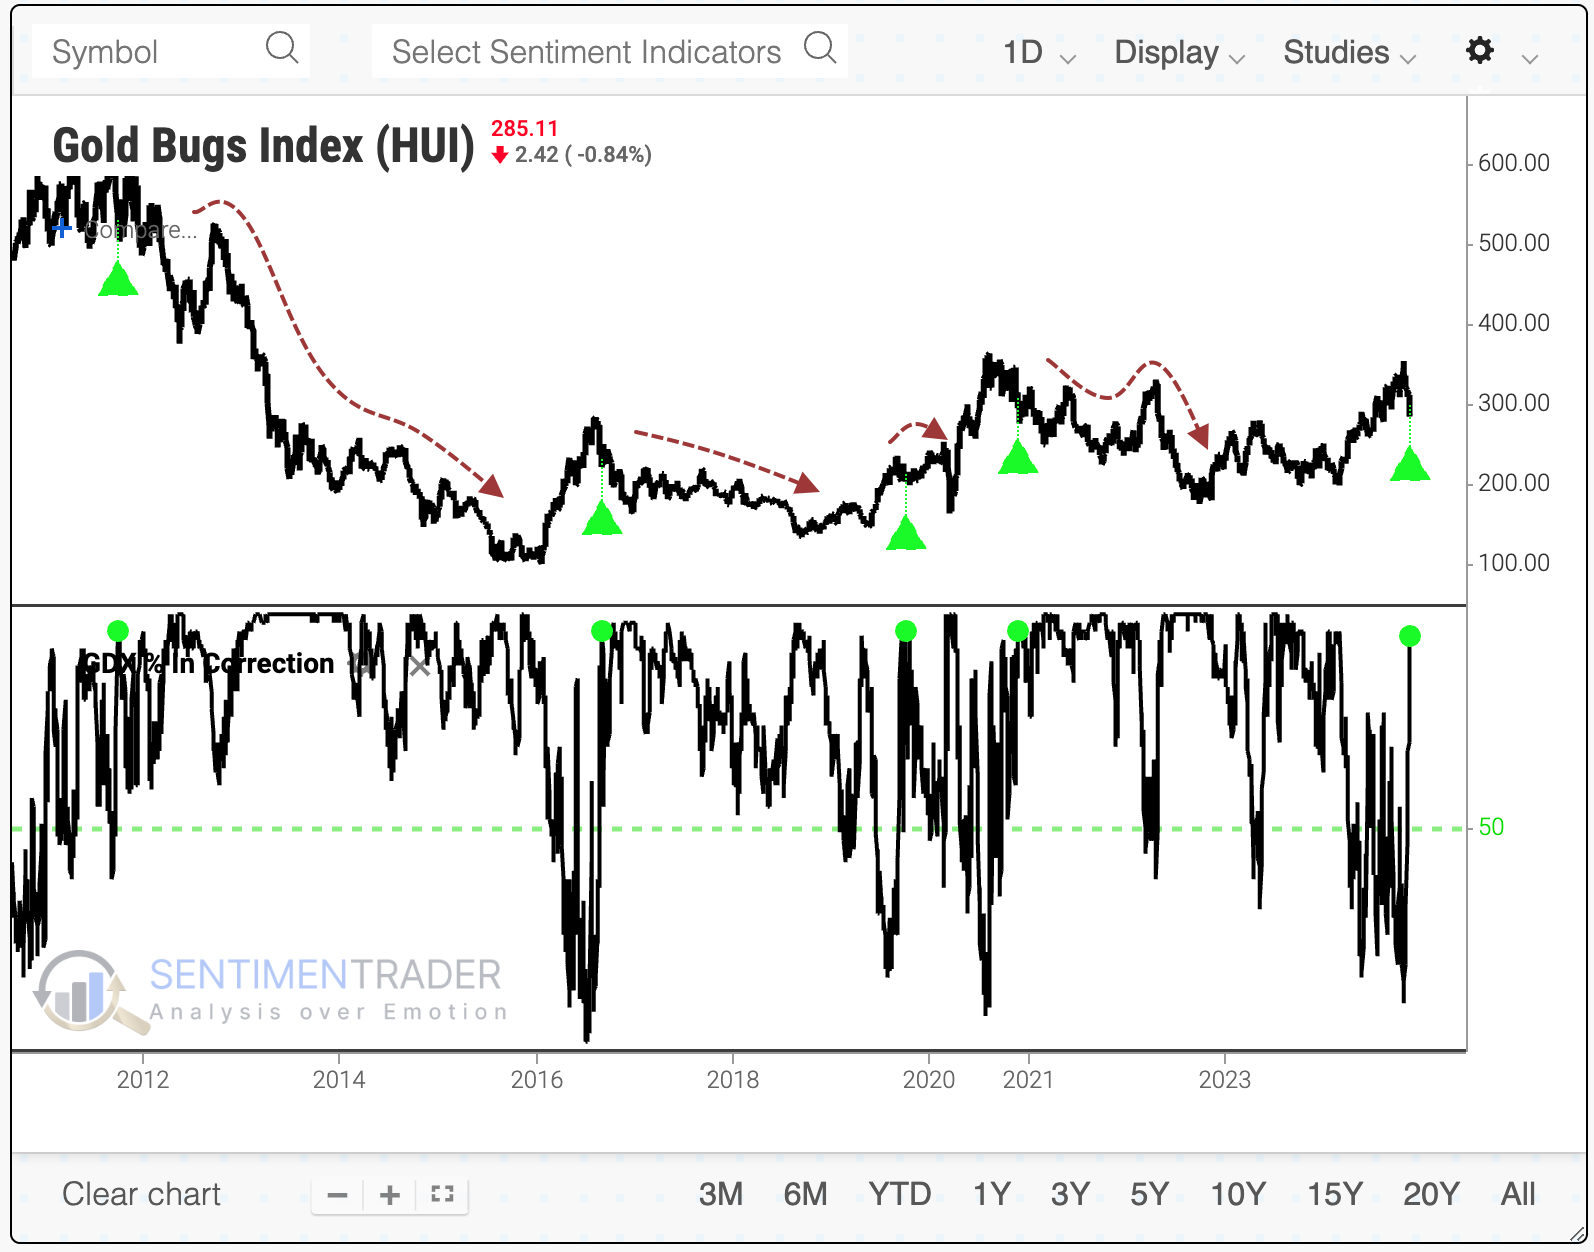
One key we watch is the percentage of gold mining stocks in bear markets, more than 20% off their 52-week highs. Few met that criterion a month ago; heading into this week, more than half did. That 50% threshold is roughly where we see the delineation between sustained bull and bear markets.
The chart below highlights those times when fewer than half of miners were in bull markets (ignoring the brief spikes above), and we see how difficult it was for gold mining indices to sustain gains when this was the case.
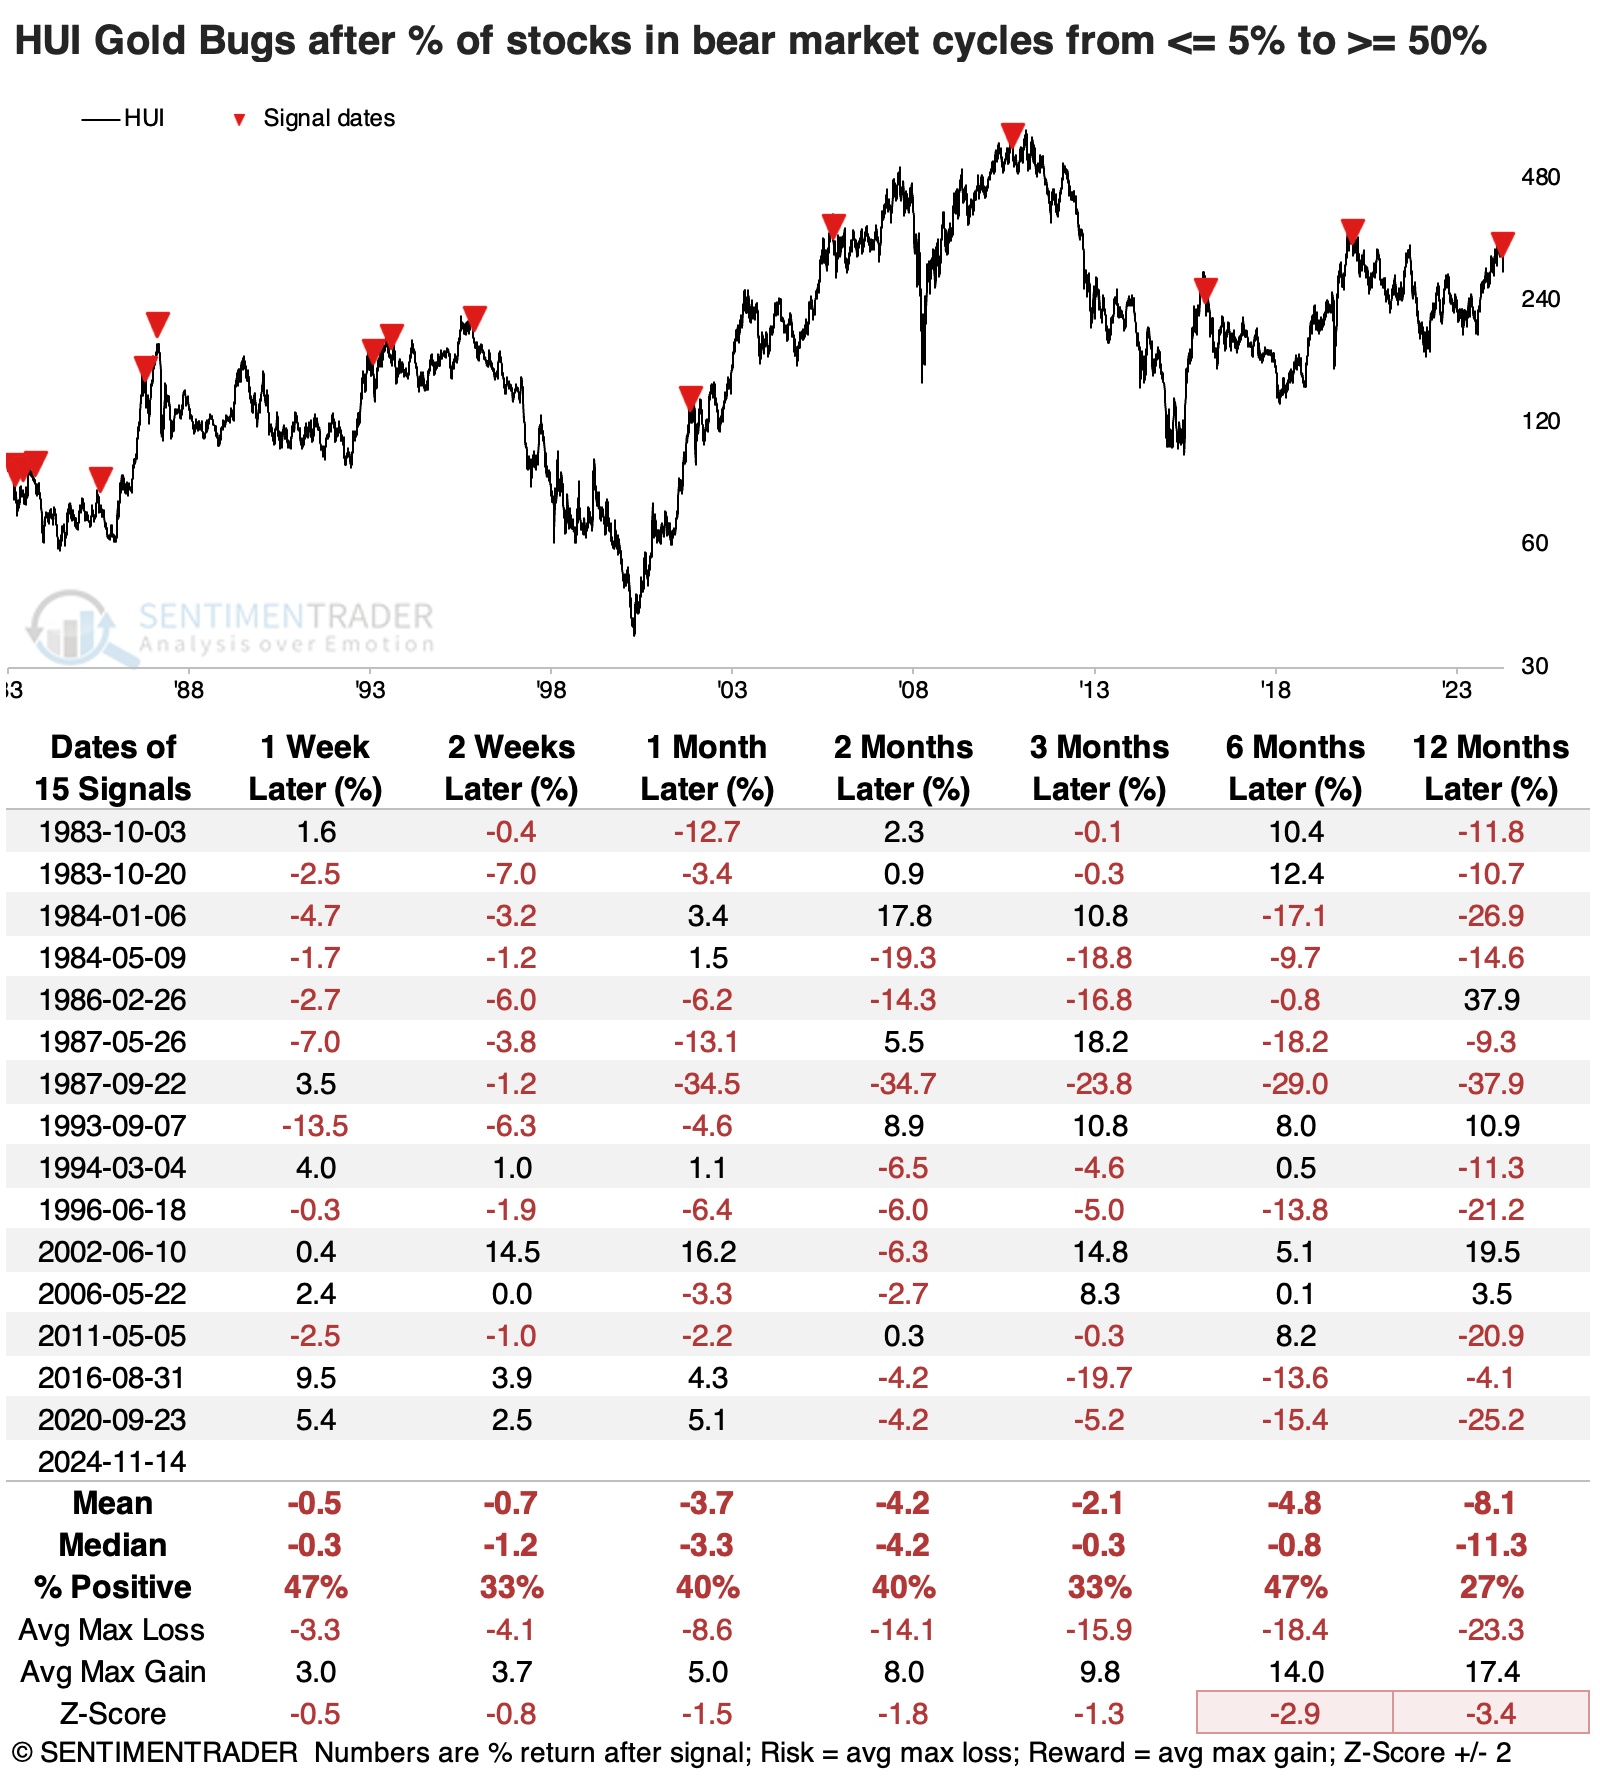
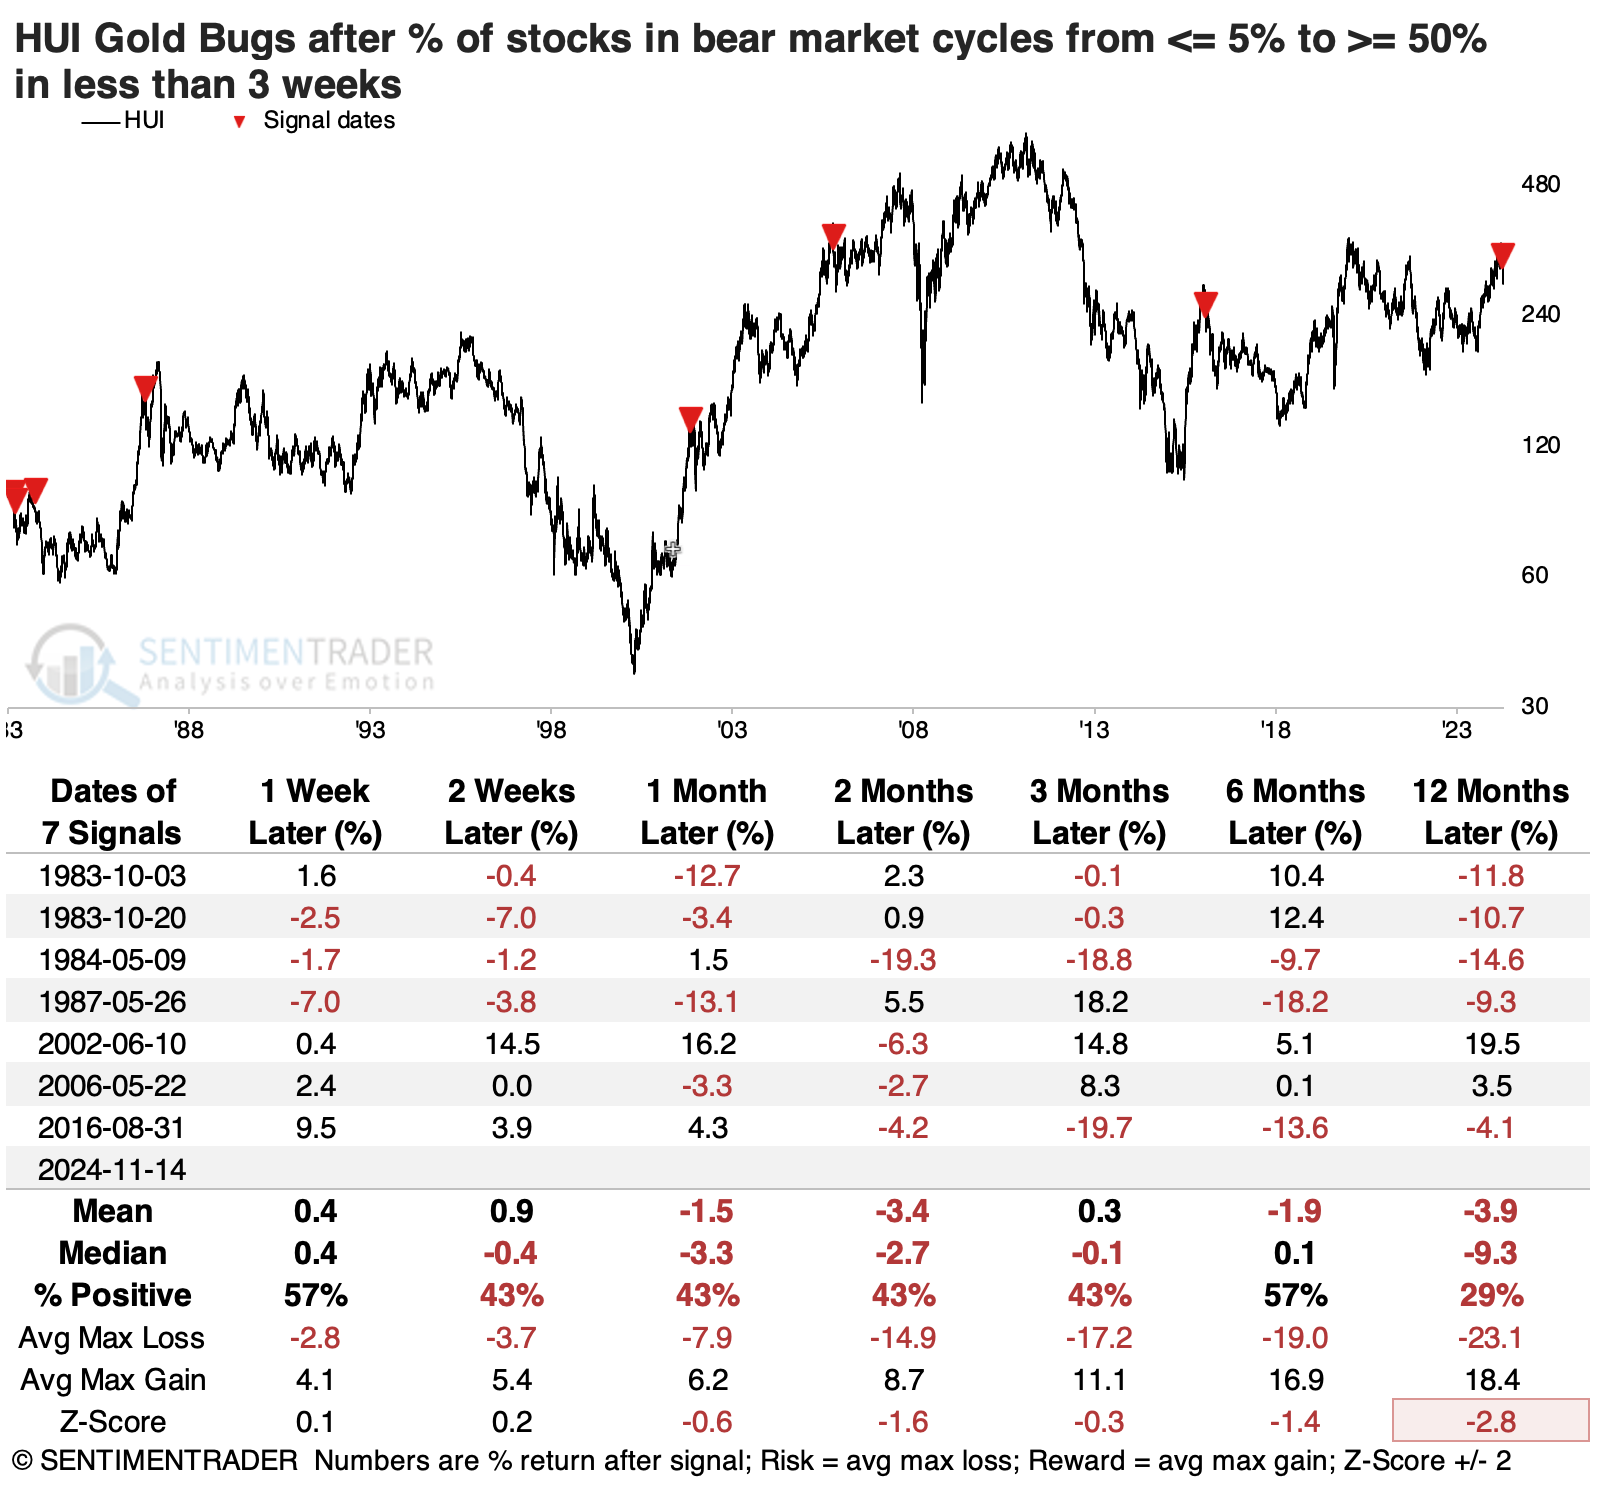
The table below shows gold miner returns when there is a cycle of fewer than 5% of them in bear markets to more than half. In recent decades, short-term returns haven't been all that bad, but over the past 30 years, they all showed a negative return two or three months later.
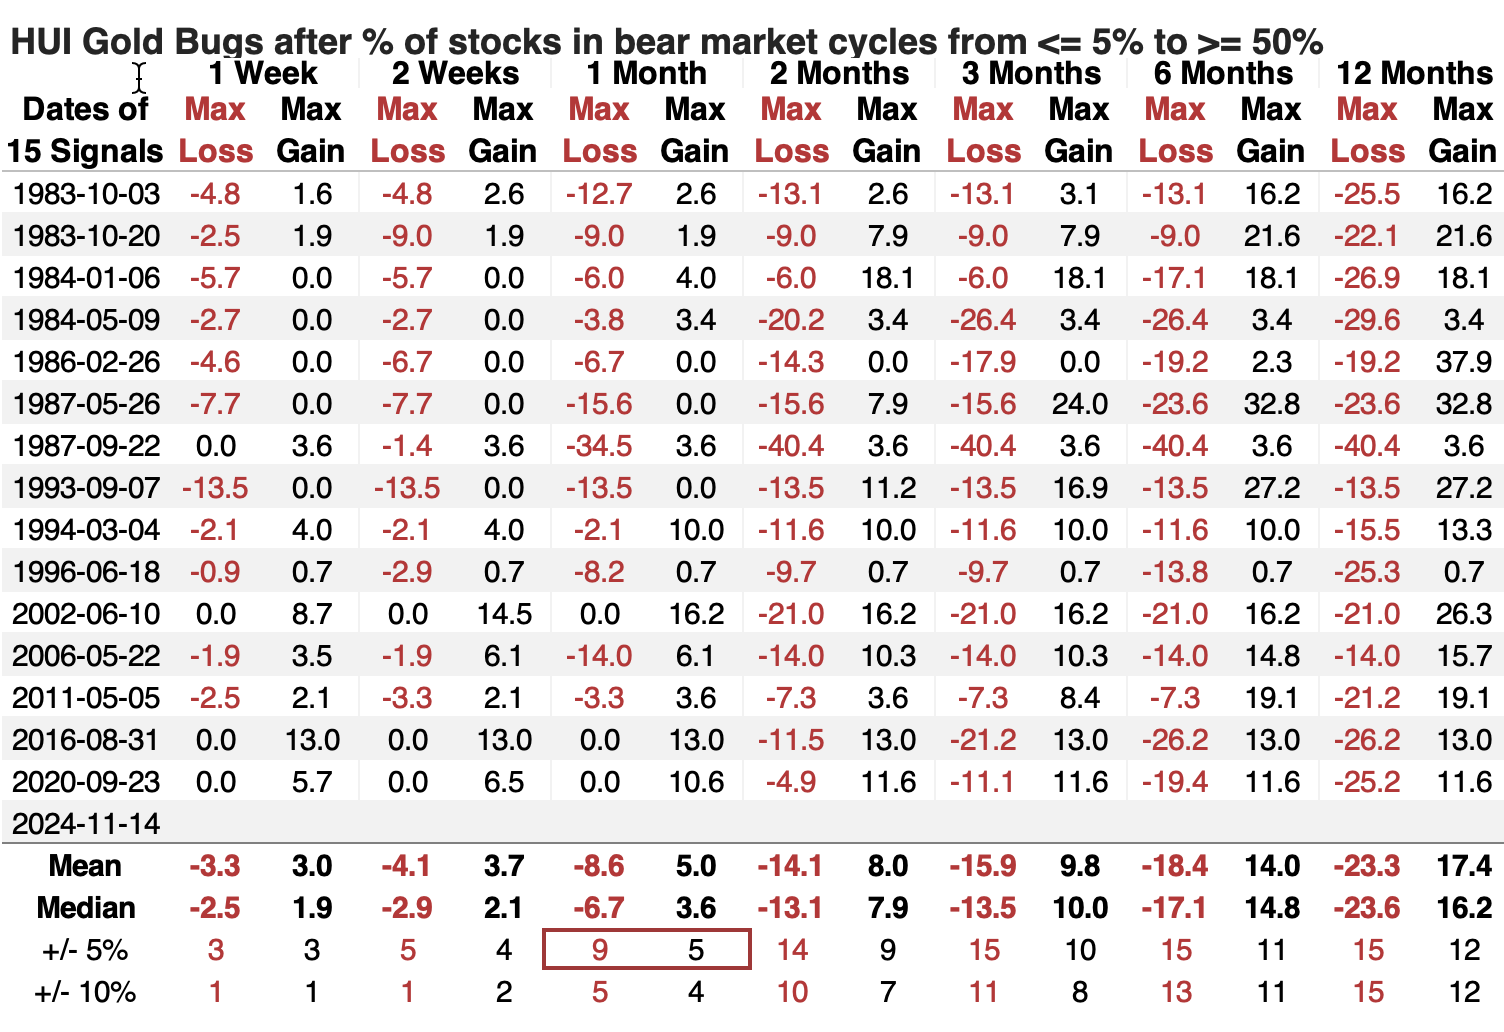
The table of maximum gains and losses across time frames shows that miners were twice as likely to suffer a further 5% pullback than enjoy a 5% gain over the next month (again, dominated by earlier decades). Across almost all time frames, there were more large losses than large gains.
The outcome doesn't change much if we focus on the quickest cycles. A couple of times, miners rebounded by double-digits over the next few months, but only one sustained gain in 2002.
More corrections
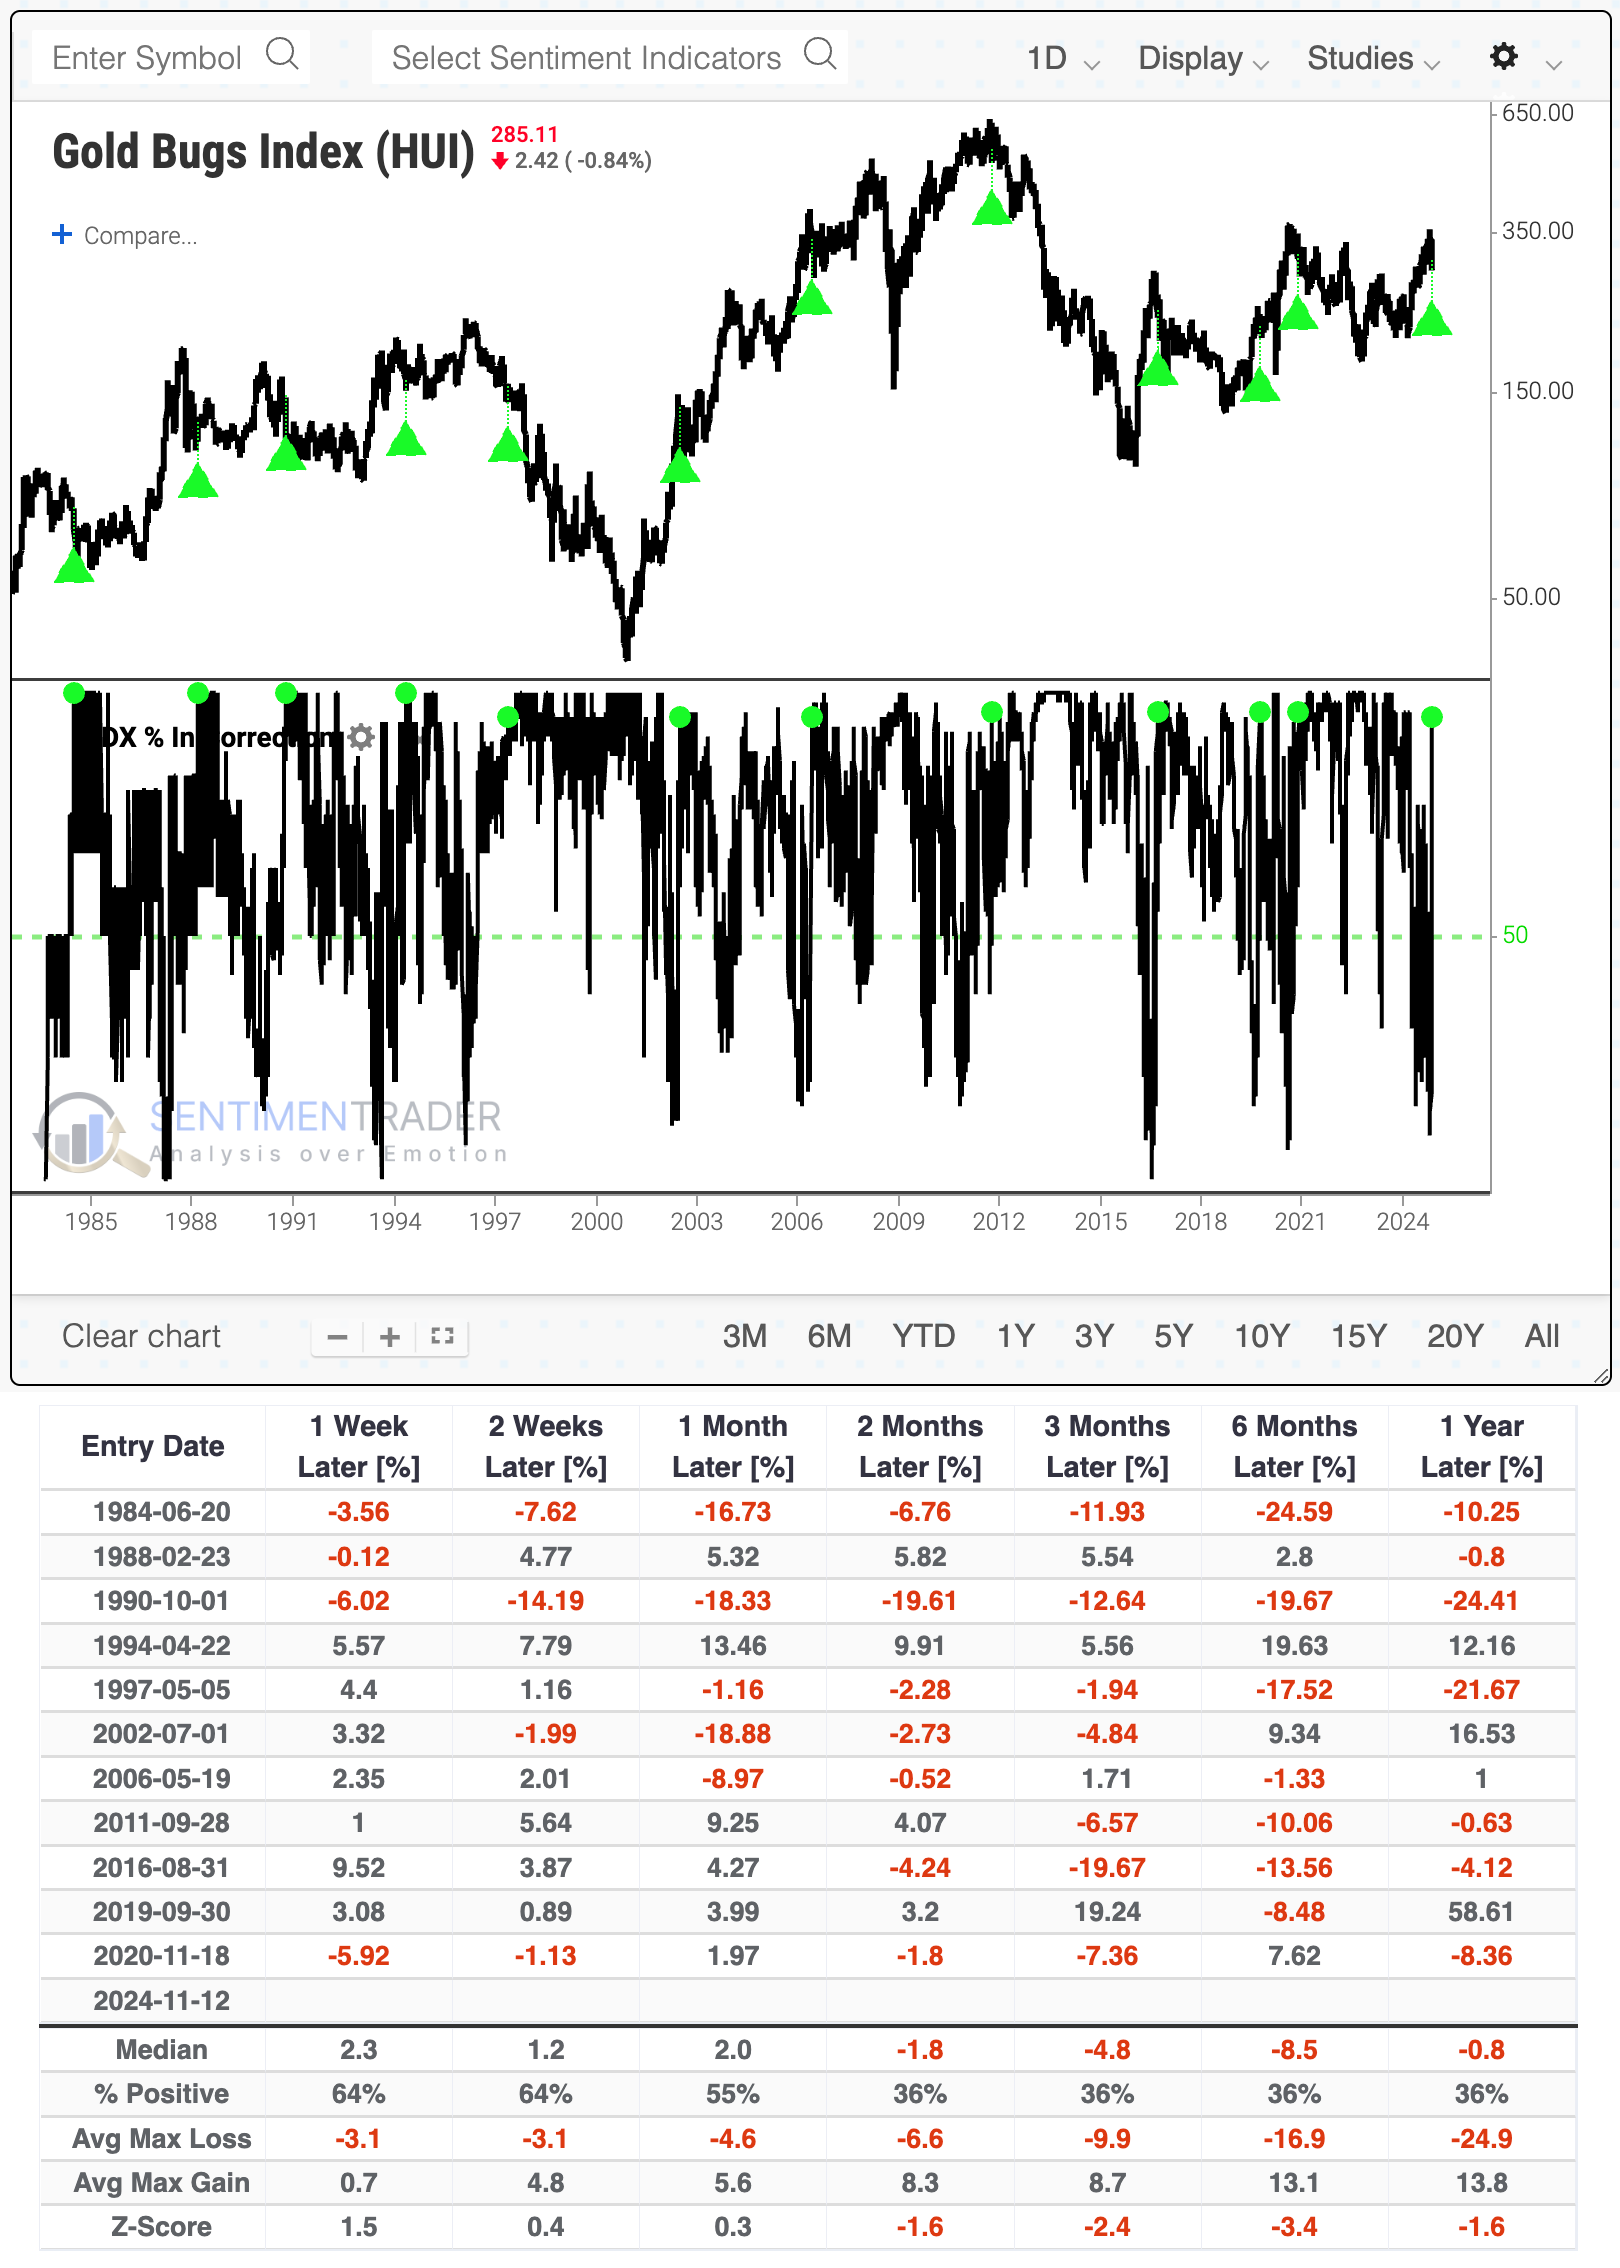
If a bunch of miners fell into bear markets, then it stands to reason that most are in corrections, using the commonly accepted definition of being at least 10% from their highs. Here, we've also seen a dramatic reversal. Just a few weeks ago, fewer than 15% of miners were in corrections, and then, coming into this week, almost all of them were. Over the past decade, similar cycles preceded tough sledding.
If we look over the past 40 years, miners managed to bounce back a few times in the weeks ahead. The next couple of weeks were actually kind of positive. But after that, it became difficult for the group to sustain the gains. Only two signals managed to escape a loss either six or twelve months later.
What the research tells us...
Being a gold bug is a special kind of hell. Gold miners don't respond like most other equity sectors when it comes to mean-reversion or momentum, making it difficult to trust developments that could be considered bullish in other indexes. Gold miners haven't usually followed through when they have high positive momentum, and they haven't tended to rebound in a sustained way after pullbacks from highs.
With the rebound this week, we may see one of those times when the quick rise in corrections and bear markets is a fake-out, as happened a few times in the past decade. If that's the case, we should have seen the worst readings. If miners fall back again and the breadth metrics deteriorate again, gold bugs should be wary of holding on no matter what.