Data &
Technology
Research
Reports
Report Solutions
Reports Library
Actionable
Strategies
Free
Resources
Simple Backtest Calculator
Simple Seasonality Calculator
The Kelly Criterion Calculator
Sentiment Geo Map
Public Research Reports
Free Webinar
Pricing
Company
About
Meet Our Team
In the News
Testimonials
Client Success Stories
Contact
Log inLoginSign up
< BACK TO ALL REPORTS

Gold Just Suffered a Low Volatility Breakdown

Jason Goepfert
2021-08-09
Gold prices have broken down to a one month low following a tight range in its Bollinger Bands

Gold futures plunged to their lowest level in a month after a solid employment report. Dean shows why this should be a concern for bullion bulls.

While a 1-month low is not unusual, the volatility in gold before preceding the drop is. What we're seeing is a low-volatility period followed by a decline. The percentage spread between the upper and lower Bollinger Bands (an indicator of volatility) had squeezed so much that it was in the bottom 3% of all values over the past 50 years before Friday's drop in prices.

Dean then ran a study to assess the forward return for gold futures when the Bollinger Band spread crossed below 2% and gold registers a 1-month low within five trading days.

Gold bollinger band

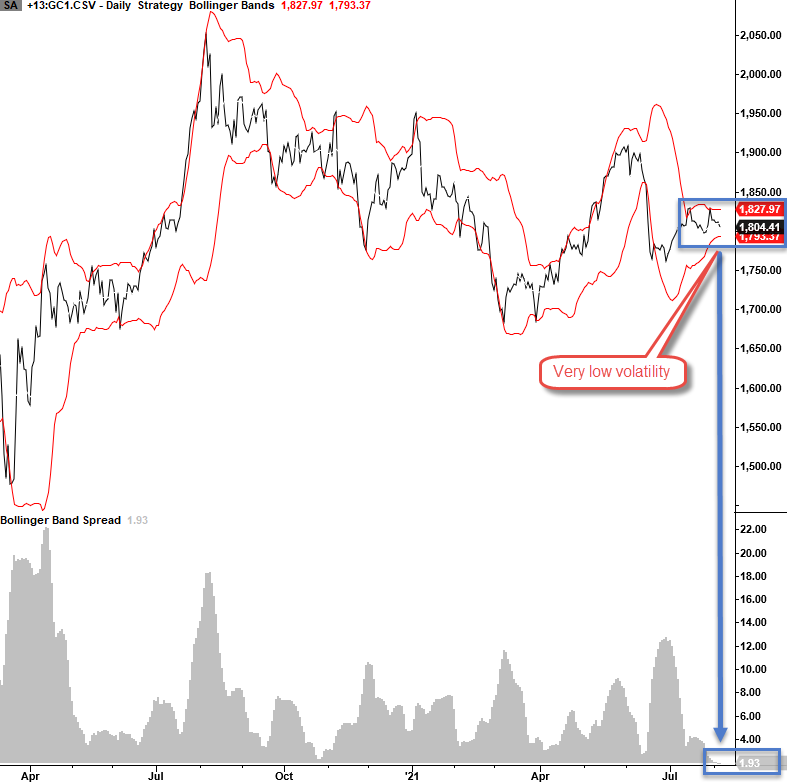
The chart above shows just how tight the Bollinger Bands had become, with the gray shaded area highlighting the spread between the upper and lower Bands. The table below looks at gold's forward return following a tight spread and then a 1-month low in gold prices.

Gold after low volatility breakdown

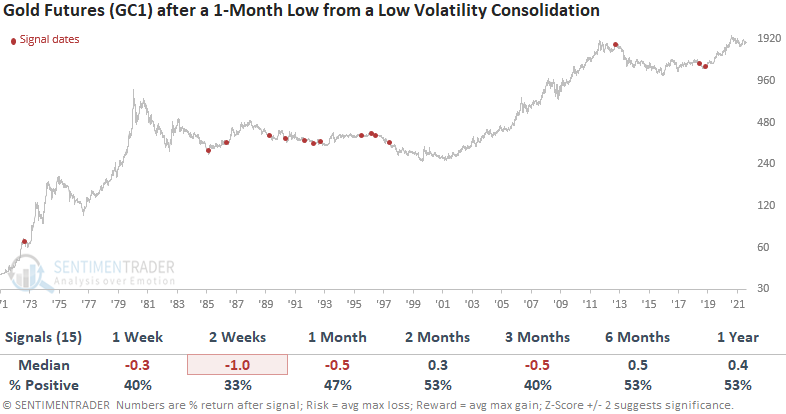
Returns across all time frames were below random, with especially bad performance over the next couple of weeks. This should prove to be a headwind as we enter the August doldrums.


What else we're looking at

  • Full returns in gold following low-volatility declines.
  • What happens when the Russell 2000 is near a high yet most of its members are in downtrends (hint: not what you'd expect)
  • Taking a look at the Risk Level in agriculture

Stat box

For the 13th time in its history, the S&P 500 has now gone 189 trading days - a full nine months - without closing more than 5% below its prior 52-week high.

Etcetera

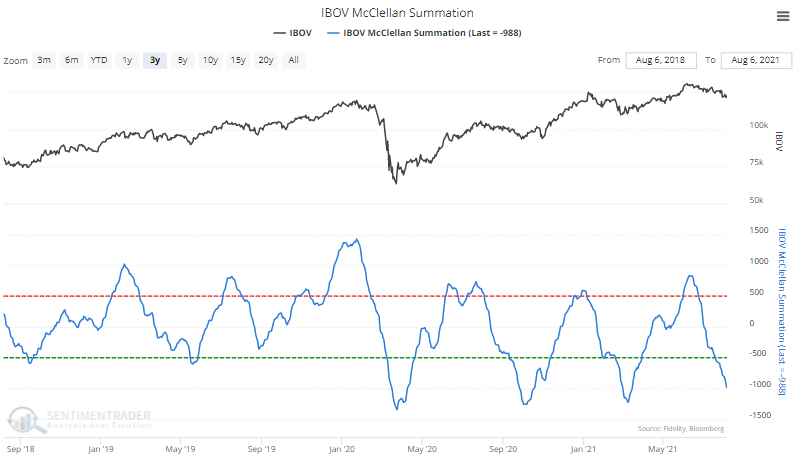
Down south. The McCellan Summation Index for Brazil's Ibovespa index has cratered, nearing -1000. Our Backtest Engine shows that over the past decade, it has reached this level 12 times, with positive returns two months later after 10 of them.

brazil ibovespa mcclellan summation index

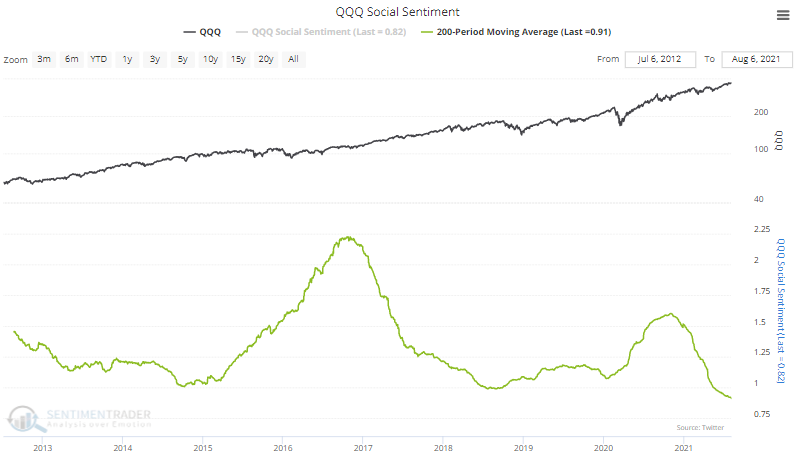
Not socially awkward. This isn't any big surprise, but the 200-day average of Social Sentiment on the Nasdaq 100 fund, QQQ, is the most positive in a decade, the first time the average has shown more positive than negative messages on social media.

qqq nasdaq 100 social sentiment

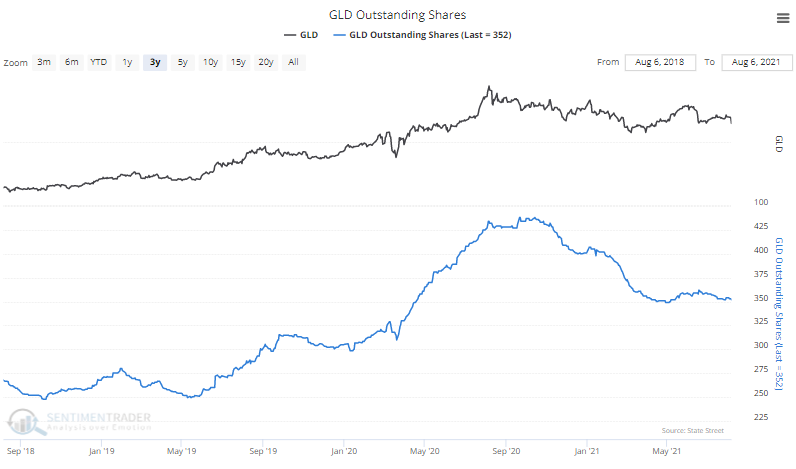
Not very shiny. Thanks to alternative funds and a general lack of enthusiasm toward gold, shares outstanding in GLD remain near their lowest level in over a year.

gold gld outstanding shares

DATA &
TECHnologies
IndicatorEdge
‍
BackTestEdge
‍
Other Tools
‍
DataEdge API
RESEARCH
reports
Research Solution
‍
Reports Library
‍
actionable
Strategies
Trading Strategies
‍
Smart Stock Scanner
‍
FREE
RESOUrCES
Simple Backtest
Calculator
Simple Seasonality
Calculator
The Kelly Criterion
Calculator
Sentiment Geo Map
‍
Public Research Reports
‍
Free Webinar
COMPANY
‍
About
‍
Meet our Team
‍
In the News
‍
Testimonials
‍
Client Success Stories
Pricing
Bundle pricing
‍
Announcements
‍
FAQ
© 2024 Sundial Capital Research Inc. All rights reserved.
Setsail Marketing
TermsPrivacyAffiliate Program
Risk Disclosure: Futures and forex trading contains substantial risk and is not for every investor. An investor could potentially lose all or more than the initial investment. Risk capital is money that can be lost without jeopardizing ones’ financial security or life style. Only risk capital should be used for trading and only those with sufficient risk capital should consider trading. Past performance is not necessarily indicative of future results.

Hypothetical Performance Disclosure: Hypothetical performance results have many inherent limitations, some of which are described below. No representation is being made that any account will or is likely to achieve profits or losses similar to those shown; in fact, there are frequently sharp differences between hypothetical performance results and the actual results subsequently achieved by any particular trading program. One of the limitations of hypothetical performance results is that they are generally prepared with the benefit of hindsight. In addition, hypothetical trading does not involve financial risk, and no hypothetical trading record can completely account for the impact of financial risk of actual trading. for example, the ability to withstand losses or to adhere to a particular trading program in spite of trading losses are material points which can also adversely affect actual trading results. There are numerous other factors related to the markets in general or to the implementation of any specific trading program which cannot be fully accounted for in the preparation of hypothetical performance results and all which can adversely affect trading results.

Testimonial Disclosure: Testimonials appearing on this website may not be representative of other clients or customers and is not a guarantee of future performance or success.