Data &
Technology
Research
Reports
Report Solutions
Reports Library
Actionable
Strategies
Free
Resources
Simple Backtest Calculator
Simple Seasonality Calculator
The Kelly Criterion Calculator
Sentiment Geo Map
Public Research Reports
Free Webinar
Pricing
Company
About
Meet Our Team
In the News
Testimonials
Client Success Stories
Contact
Log inLoginSign up
< BACK TO ALL REPORTS

Gold just did this for the 1st time in 9 months

Jason Goepfert
2020-12-02
For the first time in almost 9 months, gold fell below its 200-day moving average.

After rallying for months and generating the expected bout of excitement, the mainstay precious metal has lost its luster in favor of bitcoin. For the first time in nearly 9 months, gold has crossed below its 200-day moving average.

This ends its 10th-longest streak above its long-term average.

Gold falls below 200 day moving average

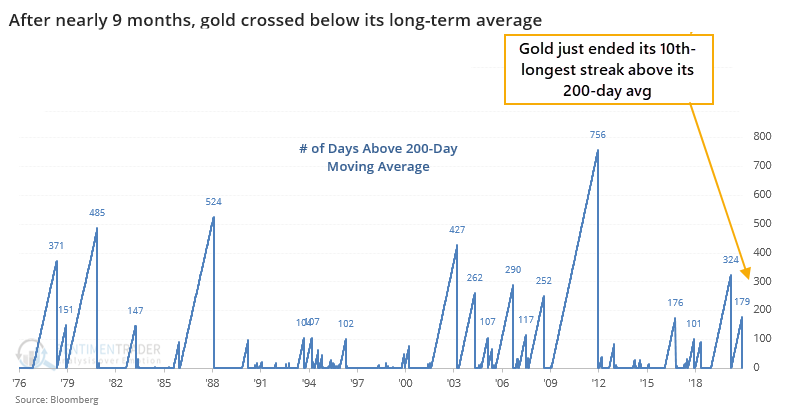
After gold ended other streaks of at least 100 days above its 200-day since 1975, it tended to resume its uptrend. Over the next month, gold rebounded more than 3/4 of the time, with a heavily positive risk/reward ratio. Returns across all time frames were consistently positive. 

It was a better signal for gold mining stocks. As was the case when gold first pulled back from a 52-week high as much as it did last week.


What else is happening

These are topics we explored in our most recent research. For immediate access with no obligation, sign up for a 30-day free trial now.

  • Full returns in gold well ended a streak above its 200-day average
  • For gold mining stocks, too
  • What happens when gold suffers its first significant pullback from a new high
  • Fewer than 3% of gold miners are above their 50-day moving average
  • What happens when gold and the U.S. dollar fall together
  • It's been a historic 8 months for the S&P 500, Nasdaq 100, and MSCI All World indexes 

Latest video - coding a trading strategy for 6 markets

Continuing our free series on using the popular programming language Python to create and test trading strategies, the video below will show you how to quickly and accurately look at a strategy across 6 markets at the same time. This is a great way to test how rules might differ depending on the market being tested.


Stat Box

The most important ETF in the world, SPY, gapped up more than 0.75% at the open on the first trading day of a new month, hitting a new high in the process. Every time it's done that since 1993, it showed a higher return 3 months later.

Sentiment from other perspectives

We don't necessarily agree with everything posted here - some of our work might directly contradict it - but it's often worth knowing what others are watching.

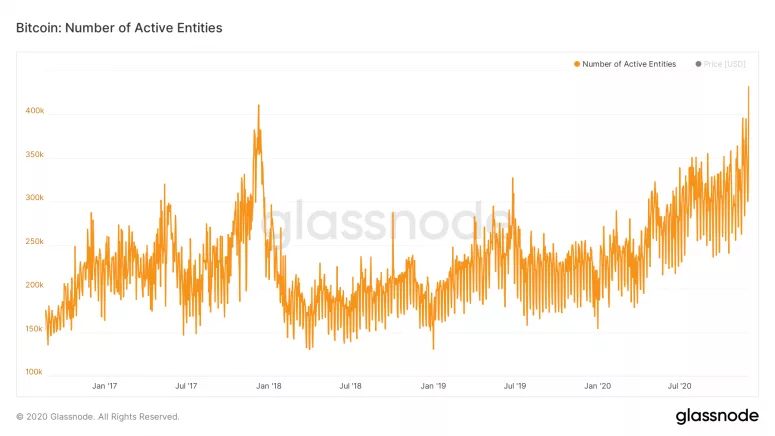
1. Bitcoin has become the place to be for speculators. Why bother with stodgy gold when you can enjoy $1,000 gains in a single day? By Tuesday, there was a record number of "active entities" either sending or receiving the coin, a record high. [Coindesk]

bitcoin volume

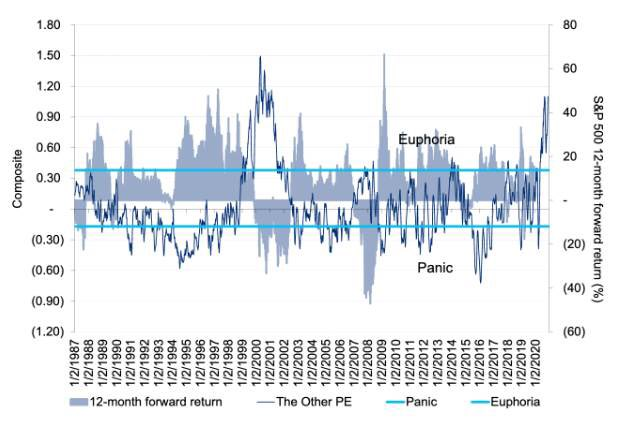
2. According to a Citi model (and pretty much all other ones, too), investors are back in the euphoria stage. Forward returns have been unkind under these conditions. [Liz Ann Sonders]

citi panic euphoria

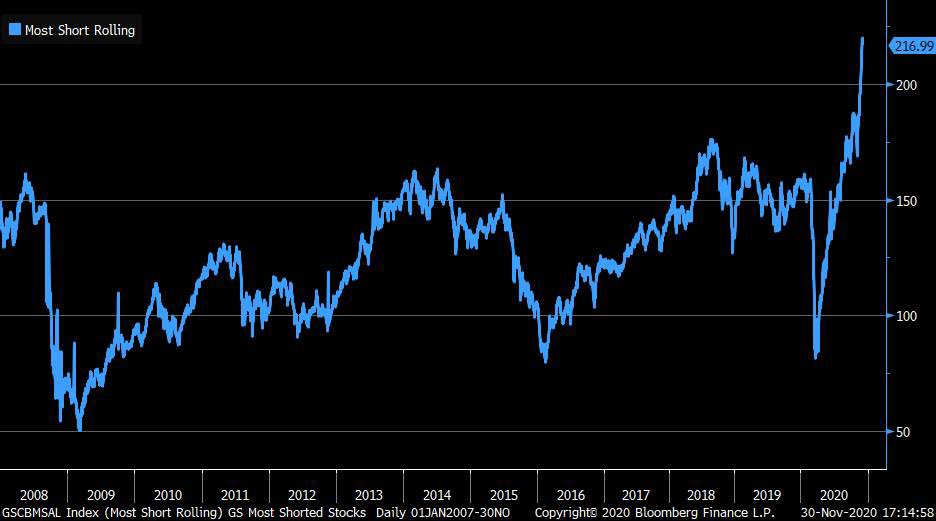
3. Apply ice to burned area. Short-sellers are among the few who are decidedly not feeling euphoric nowadays. A basket of most-shorted stocks has not only hit new highs, it has done so in a parabolic manner. [Bloomberg via Liz Ann Sonders]

popular short seller stock basket

DATA &
TECHnologies
IndicatorEdge
‍
BackTestEdge
‍
Other Tools
‍
DataEdge API
RESEARCH
reports
Research Solution
‍
Reports Library
‍
actionable
Strategies
Trading Strategies
‍
Smart Stock Scanner
‍
FREE
RESOUrCES
Simple Backtest
Calculator
Simple Seasonality
Calculator
The Kelly Criterion
Calculator
Sentiment Geo Map
‍
Public Research Reports
‍
Free Webinar
COMPANY
‍
About
‍
Meet our Team
‍
In the News
‍
Testimonials
‍
Client Success Stories
Pricing
Bundle pricing
‍
Announcements
‍
FAQ
© 2024 Sundial Capital Research Inc. All rights reserved.
Setsail Marketing
TermsPrivacyAffiliate Program
Risk Disclosure: Futures and forex trading contains substantial risk and is not for every investor. An investor could potentially lose all or more than the initial investment. Risk capital is money that can be lost without jeopardizing ones’ financial security or life style. Only risk capital should be used for trading and only those with sufficient risk capital should consider trading. Past performance is not necessarily indicative of future results.

Hypothetical Performance Disclosure: Hypothetical performance results have many inherent limitations, some of which are described below. No representation is being made that any account will or is likely to achieve profits or losses similar to those shown; in fact, there are frequently sharp differences between hypothetical performance results and the actual results subsequently achieved by any particular trading program. One of the limitations of hypothetical performance results is that they are generally prepared with the benefit of hindsight. In addition, hypothetical trading does not involve financial risk, and no hypothetical trading record can completely account for the impact of financial risk of actual trading. for example, the ability to withstand losses or to adhere to a particular trading program in spite of trading losses are material points which can also adversely affect actual trading results. There are numerous other factors related to the markets in general or to the implementation of any specific trading program which cannot be fully accounted for in the preparation of hypothetical performance results and all which can adversely affect trading results.

Testimonial Disclosure: Testimonials appearing on this website may not be representative of other clients or customers and is not a guarantee of future performance or success.