Data &
Technology
Research
Reports
Report Solutions
Reports Library
Actionable
Strategies
Free
Resources
Simple Backtest Calculator
Simple Seasonality Calculator
The Kelly Criterion Calculator
Sentiment Geo Map
Public Research Reports
Free Webinar
Pricing
Company
About
Meet Our Team
In the News
Testimonials
Client Success Stories
Contact
Log inLoginSign up
< BACK TO ALL REPORTS

Gold Bugs Haven't Liked This Trend

Jason Goepfert
2021-08-27
Gold has climbed toward the upper end of its 2-month range while gold mining stocks have been mired in the bottom part of their range.

When gold tries to change its long-term trend, it usually struggle. Its sensitivity to economic surprises and interest rates also hasn't helped the outlook over the past few months.

After a June plunge, though, gold has been treading water until recently. After a good week, gold is now trading in the upper end of its 2-month range. Gold mining stocks, however, are struggling.

Looking at each of them relative to their ranges of the past 2 months, we can see how stark this divergence is.

Gold versus miner 2 month range

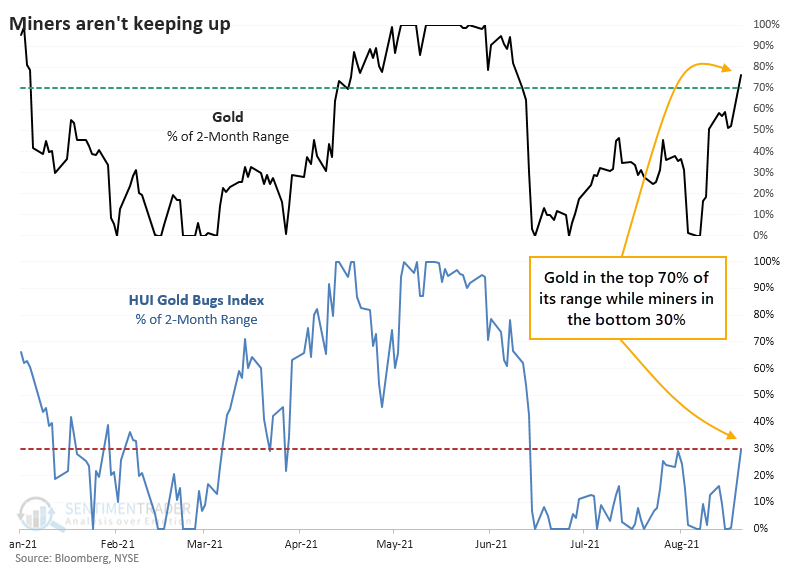
When mining stocks were in a downtrend at the time, this was not a good sign. After similar divergences between gold and mining stocks, both gold and miners struggled in the weeks and months ahead.

Weakness over the past few weeks, in particular, has meant that some of the breadth metrics among mining stocks that we calculate are starting to reach oversold levels. For example, last week, more than a third of mining stocks fell to a 52-week low, the most in 3 years. That's a high number for a medium-term washout but is well under the 50% or higher figure we see during long-term panics.


What else we're looking at

  • Full returns in gold and mining stocks following divergences in their 2-month ranges
  • A look at the spike in 52-week lows among gold mining stocks
  • The seasonal outlook for gold and mining stocks
  • Using the relative rank of micro-cap stocks as an indicator for the broader market
  • Using utilities as a risk-on indicator

Stat box

Traders pulled more than $185 million out of the SMH semiconductor fund on back-to-back days. This is the first time since 2018 that the fund has suffered such large outflows on consecutive days.

Etcetera

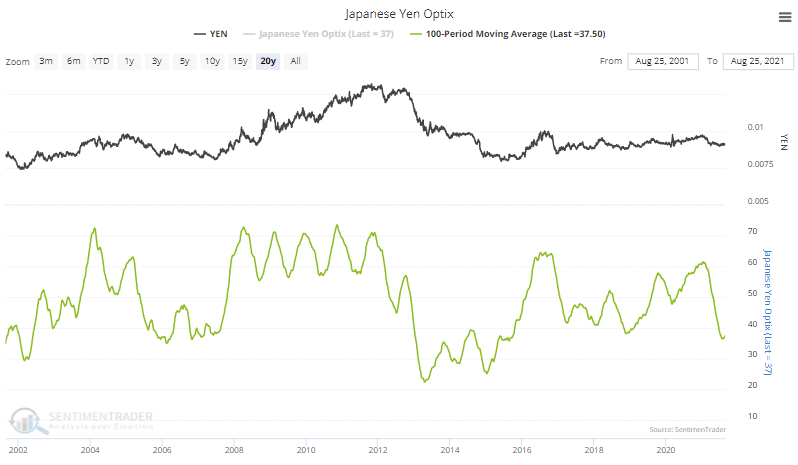
No yen for the yen. Out of all markets we cover, the 100-day Optimism Index for the Japanese yen is the lowest. It's just now trying to curl higher from its 3rd-lowest reading of the past 20 years.

yen sentiment

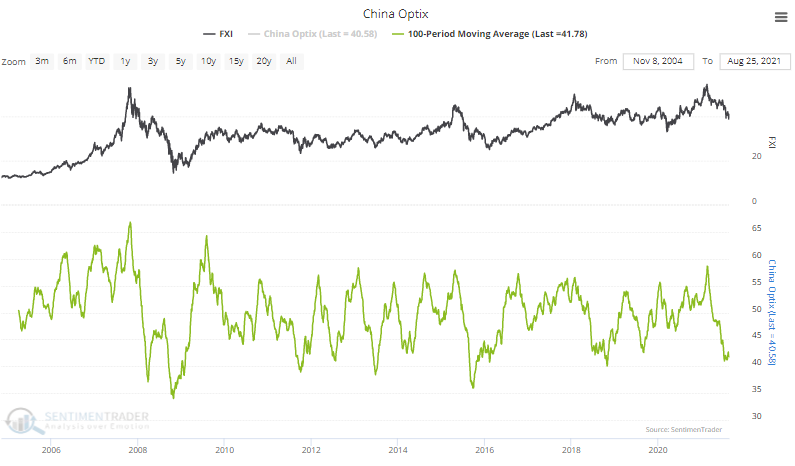
Or Chinese stocks. Sticking with the same theme, the 2nd-lowest amount of optimism over the past 100 days is in the FXI fund focused on Chinese stocks. It's trying to rise from the 2nd-lowest reading in 5 years.

fxi china sentiment

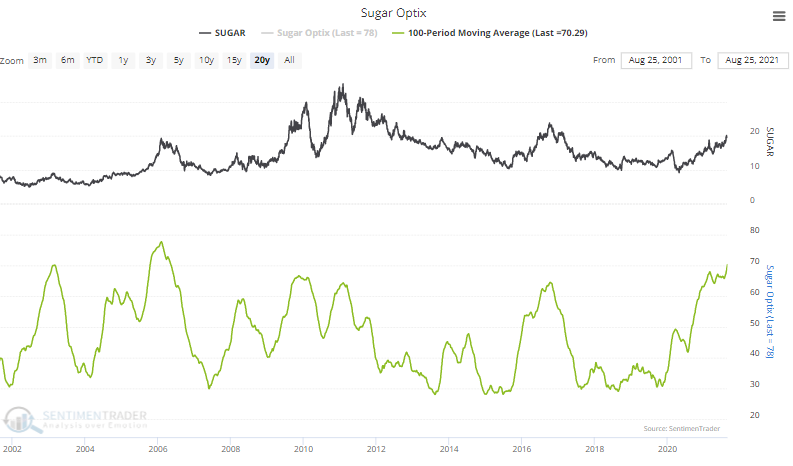
Sugar high. On the other end of the spectrum, a market with the highest average Optimism Index over the past 100 days is sugar. It's currently at the highest level since 2006.

sugar sentiment

DATA &
TECHnologies
IndicatorEdge
‍
BackTestEdge
‍
Other Tools
‍
DataEdge API
RESEARCH
reports
Research Solution
‍
Reports Library
‍
actionable
Strategies
Trading Strategies
‍
Smart Stock Scanner
‍
FREE
RESOUrCES
Simple Backtest
Calculator
Simple Seasonality
Calculator
The Kelly Criterion
Calculator
Sentiment Geo Map
‍
Public Research Reports
‍
Free Webinar
COMPANY
‍
About
‍
Meet our Team
‍
In the News
‍
Testimonials
‍
Client Success Stories
Pricing
Bundle pricing
‍
Announcements
‍
FAQ
© 2024 Sundial Capital Research Inc. All rights reserved.
Setsail Marketing
TermsPrivacyAffiliate Program
Risk Disclosure: Futures and forex trading contains substantial risk and is not for every investor. An investor could potentially lose all or more than the initial investment. Risk capital is money that can be lost without jeopardizing ones’ financial security or life style. Only risk capital should be used for trading and only those with sufficient risk capital should consider trading. Past performance is not necessarily indicative of future results.

Hypothetical Performance Disclosure: Hypothetical performance results have many inherent limitations, some of which are described below. No representation is being made that any account will or is likely to achieve profits or losses similar to those shown; in fact, there are frequently sharp differences between hypothetical performance results and the actual results subsequently achieved by any particular trading program. One of the limitations of hypothetical performance results is that they are generally prepared with the benefit of hindsight. In addition, hypothetical trading does not involve financial risk, and no hypothetical trading record can completely account for the impact of financial risk of actual trading. for example, the ability to withstand losses or to adhere to a particular trading program in spite of trading losses are material points which can also adversely affect actual trading results. There are numerous other factors related to the markets in general or to the implementation of any specific trading program which cannot be fully accounted for in the preparation of hypothetical performance results and all which can adversely affect trading results.

Testimonial Disclosure: Testimonials appearing on this website may not be representative of other clients or customers and is not a guarantee of future performance or success.