
Gold bugs are selling out

Key points:
- Gold mining stocks have been sold hard over the past couple of weeks
- The selling pressure has been enough to trigger an extreme reading in a Panic Breadth Composite
- How investors treat this latest dip should go a long way toward showing the potential risk versus reward for the months ahead
Gold mining stocks continue to disappoint
Being a gold bug is a trying endeavor.
You're suffering losses most of the time while most other investors are enjoying easy gains. But every once in a while, you get rewarded handsomely, usually while almost everyone else is panicking. Maybe that's why so many gold bugs seem cynical and smug.
The latest round of selling pressure must have been excruciating because gold hasn't served as much of a balm against losses in other markets. So much for being smug.
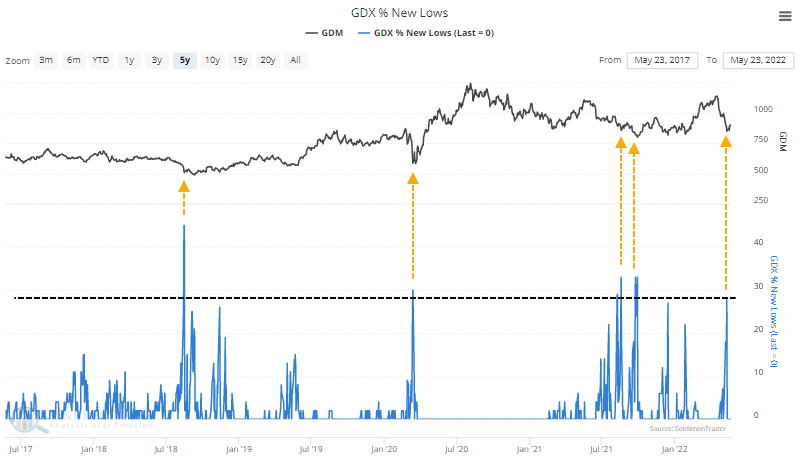
At the worst point during the latest round of selling pressure, more than a quarter of gold mining stocks fell to a 52-week low at the same time. Over the past five years, that has meant a bottom.
Remarkably, almost every gold miner has been trading below its 50-day average for most of the past two weeks. The only comparable bout of depressing trends over the past five years was triggered during the pandemic crash in March 2020.
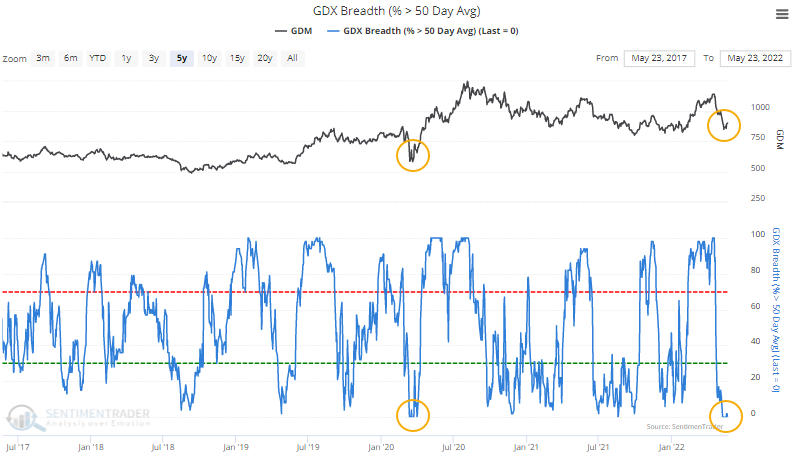
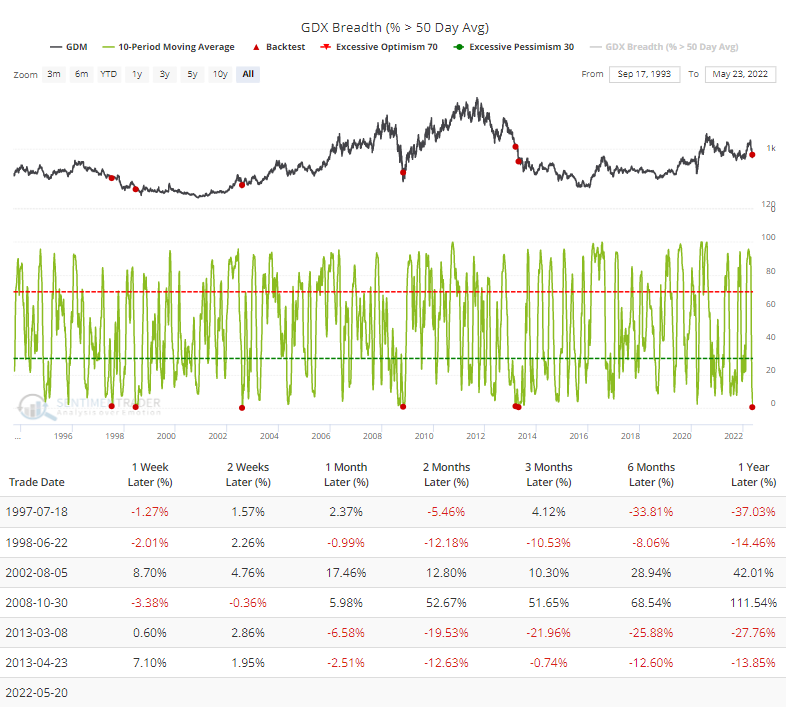
This one has been even worse than that crash. On an average day over the past two weeks, fewer than 1% of gold miners held above their 50-day averages. The last time that happened was in 2013. The Backtest Engine shows that over the past 40 years, it has gotten this bad only a handful of times.
Unfortunately for those looking for an opportunity, future returns were inconsistent. Gold miners either boomed or busted, with no real in-between.
As we've done with other sectors or indexes like the Shanghai Composite in April, we can calculate a Panic Breadth Composite that considers a half-dozen different breadth metrics.
- % of gold miners above 10-day average
- % of gold miners above 50-day average
- % of gold miners above 200-day average
- % of gold miners at 52-week low
- % of gold miners in a correction
- % of gold miners in a bear market
The 5-day average of this Composite just climbed above 75%, in the top 5% of all days since 1983.
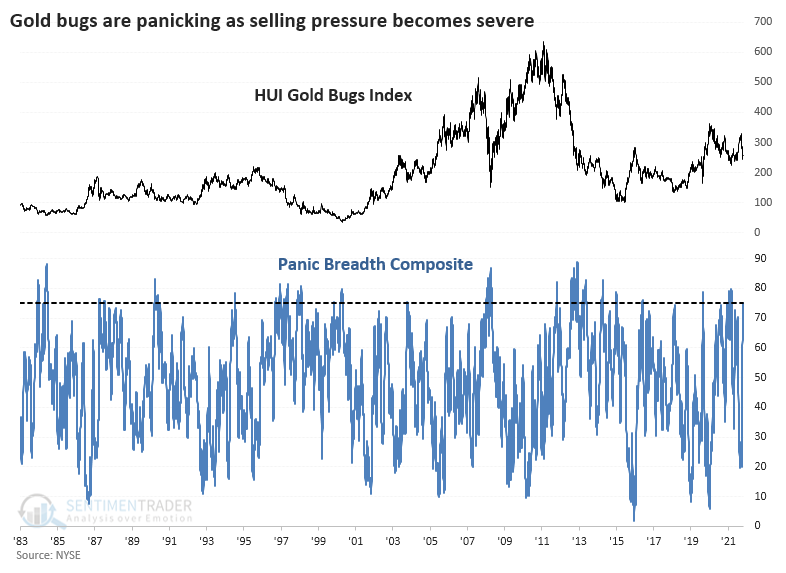
Once again, this was not a clear buy signal. Returns in the Gold Bugs index showed some fantastic gains and some terrible losses.
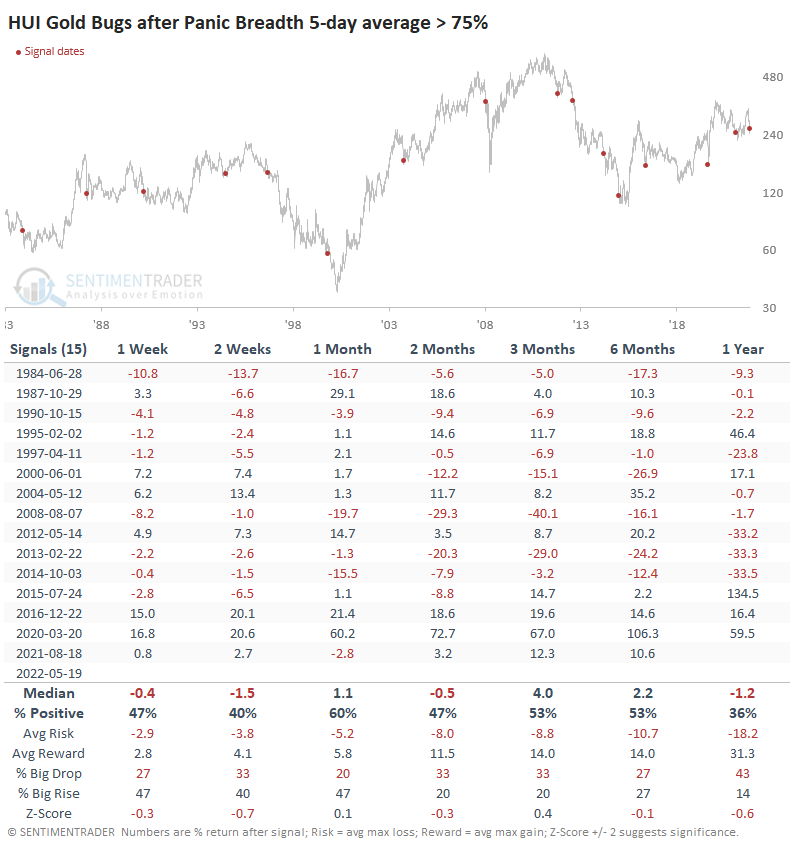
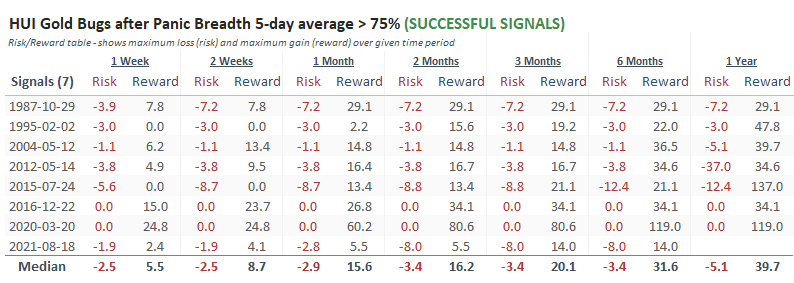
The Risk/Reward Table below shows only the most successful signals, with the best risk/reward profiles over the next 6-12 months. There isn't a single rule that dictates whether the signal would lead to sustained gains. But, generally, the HUI Gold Bugs Index showed short-term buying interest that overwhelmed selling pressure. That wasn't always the case (e.g., Feb 1995 and Jul 2015), but it was a decent heuristic.
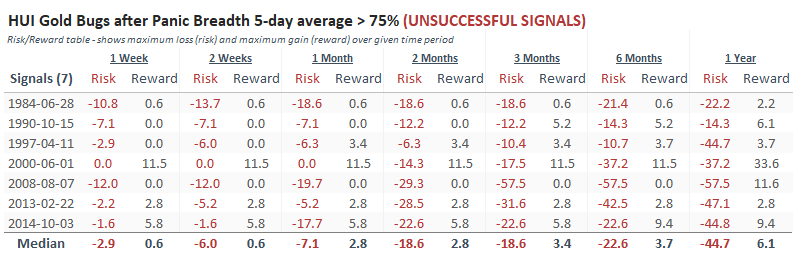
Contrast that to the unsuccessful signals, with the worst risk/reward skews. After most of these, sellers dominated in the short (and long) term. Again, it wasn't perfect (e.g., Jun 2000 and Oct 2014)
What the research tells us...
When gold mining stocks enjoyed a thrust in March, they demonstrated the kind of momentum that has typically persisted in the long-term. In April, the selling pressure generated modest oversold signals, which had a good record at preceding gains when they follow upside momentum like March. But gold and the stocks that mine the metal have a long history of disappointing investors, and this one has been no different so far. According to the Risk/Reward Tables above, if gold bugs can build on some nascent eagerness to buy the recent dip, according to the Risk/Reward Tables above, that should be a good long-term sign.