Data &
Technology
Research
Reports
Report Solutions
Reports Library
Actionable
Strategies
Free
Resources
Simple Backtest Calculator
Simple Seasonality Calculator
The Kelly Criterion Calculator
Sentiment Geo Map
Public Research Reports
Free Webinar
Pricing
Company
About
Meet Our Team
In the News
Testimonials
Client Success Stories
Contact
Log inLoginSign up
< BACK TO ALL REPORTS

Gold Beats Stocks' Double-Digit Jump

Jason Goepfert
2019-08-21
null

This is an abridged version of our recent reports and notes. For immediate access with no obligation, sign up for a 30-day free trial now.

Rising and falling together

The major sectors within the S&P 500 have mostly been moving in concert, so correlations have risen quickly over the past month. Correlations are also rising among safe-haven assets.

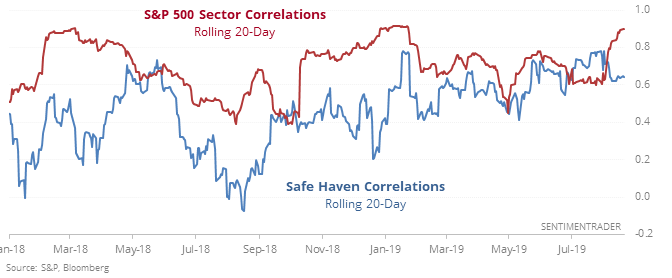
When both sets of correlations have been this high in the past, it has generally coincided with times of high anxiety in markets, preceding gains in the S&P 500 every time but once over the next 6-12 months, with the exception being a signal right before the worst of the financial crisis. For the other assets, it was less of a signal.

Gold beats stocks’ double-digit jump

The S&P 500 is up double digits in 2019, but still can’t beat the gain in gold.

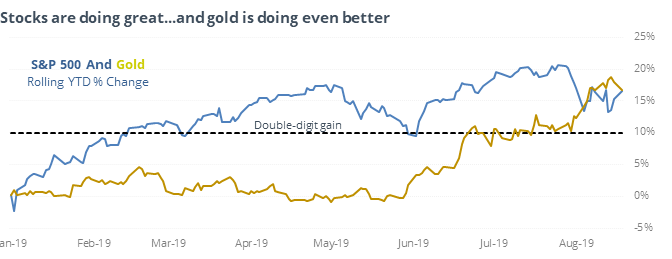
While that could be considered a sign of risk-aversion among investors, and it may be, it wasn’t necessarily a negative signal. Stocks (and gold) mostly rose after similar behavior. Same goes for when gold's rolling 1-year return beat the S&P's double-digit gain.

Trying to turn

The momentum of rising and falling securities on the NYSE has turned positive after weeks in negative territory, and longer-term momentum remains solidly positive. That combination has led to good long-term returns, with only a couple of modest losses over the medium- to long-term.

Lagging Small-Caps

The ratio of the S&P 500 to Russell 2000 has been in an uptrend for nearly a year, meaning that small-caps have consistently lagged. While that's usually taken as a troubling sign, historically it hasn't proven out that way.

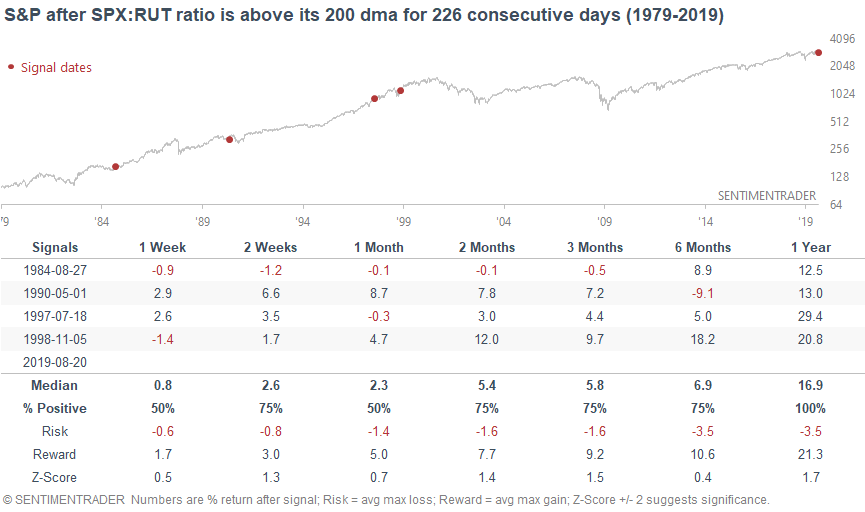
A big part of the reason is diverging paths of forward earnings for the S&P 500 versus it's small-cap brethren. While the 12-month forward earnings trend is negative for smaller-caps, it remains positive for the larger-cap S&P 500, and that has been a good signal.

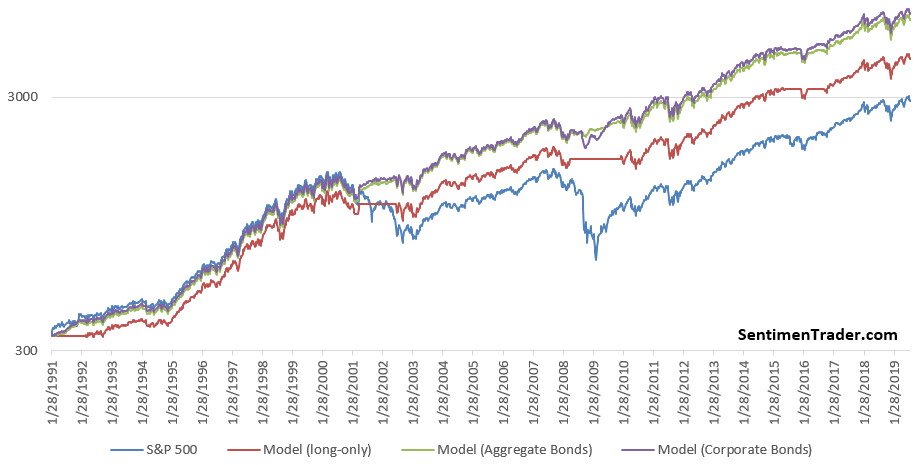
Below, we can see an equity curve if we buy and hold the S&P versus switching to cash when earnings are negative, or switch to bonds. Currently this is still on a buy signal.

Big shift

More than 90% of stocks in Hong Kong’s Hang Seng index have managed to climb above their short-term 10-day moving averages, following a time when fewer than 5% of them did so and still less than half are trading above their long-term 200-day averages (showing short-term bursts of buying interests in long-term downtrends). This has triggered 5 times in the past 17 years, all leading to double-digit gains over the next 6 months.

DATA &
TECHnologies
IndicatorEdge
‍
BackTestEdge
‍
Other Tools
‍
DataEdge API
RESEARCH
reports
Research Solution
‍
Reports Library
‍
actionable
Strategies
Trading Strategies
‍
Smart Stock Scanner
‍
FREE
RESOUrCES
Simple Backtest
Calculator
Simple Seasonality
Calculator
The Kelly Criterion
Calculator
Sentiment Geo Map
‍
Public Research Reports
‍
Free Webinar
COMPANY
‍
About
‍
Meet our Team
‍
In the News
‍
Testimonials
‍
Client Success Stories
Pricing
Bundle pricing
‍
Announcements
‍
FAQ
© 2024 Sundial Capital Research Inc. All rights reserved.
Setsail Marketing
TermsPrivacyAffiliate Program
Risk Disclosure: Futures and forex trading contains substantial risk and is not for every investor. An investor could potentially lose all or more than the initial investment. Risk capital is money that can be lost without jeopardizing ones’ financial security or life style. Only risk capital should be used for trading and only those with sufficient risk capital should consider trading. Past performance is not necessarily indicative of future results.

Hypothetical Performance Disclosure: Hypothetical performance results have many inherent limitations, some of which are described below. No representation is being made that any account will or is likely to achieve profits or losses similar to those shown; in fact, there are frequently sharp differences between hypothetical performance results and the actual results subsequently achieved by any particular trading program. One of the limitations of hypothetical performance results is that they are generally prepared with the benefit of hindsight. In addition, hypothetical trading does not involve financial risk, and no hypothetical trading record can completely account for the impact of financial risk of actual trading. for example, the ability to withstand losses or to adhere to a particular trading program in spite of trading losses are material points which can also adversely affect actual trading results. There are numerous other factors related to the markets in general or to the implementation of any specific trading program which cannot be fully accounted for in the preparation of hypothetical performance results and all which can adversely affect trading results.

Testimonial Disclosure: Testimonials appearing on this website may not be representative of other clients or customers and is not a guarantee of future performance or success.