
Gold bear, gold bull

Key Points
- Seasonality strongly suggests that patience is still in order for gold and gold stock traders
- Real interest rates also currently serve as a headwind for gold
- However, a variety of sentiment and price action-related indicators have flashed favorable signals recently
First, the bad news
Rates and the calendar argue for lower gold prices in the weeks ahead, but several other indicators counter those potential negatives.
The chart below displays the annual seasonal trend for gold. It is about to enter a period of general price weakness. For 2022, this period extends from 2022-10-20 through 2022-11-03.
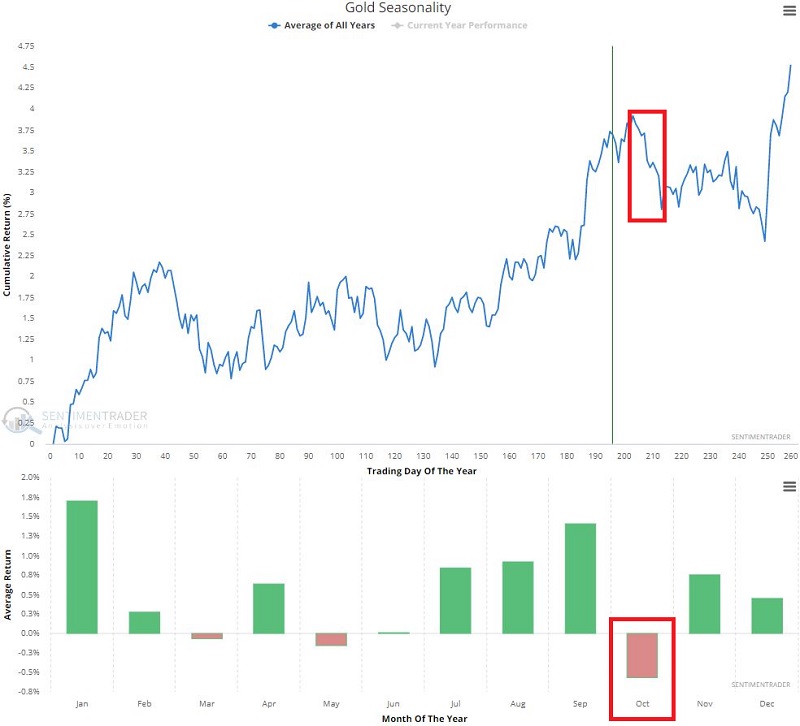
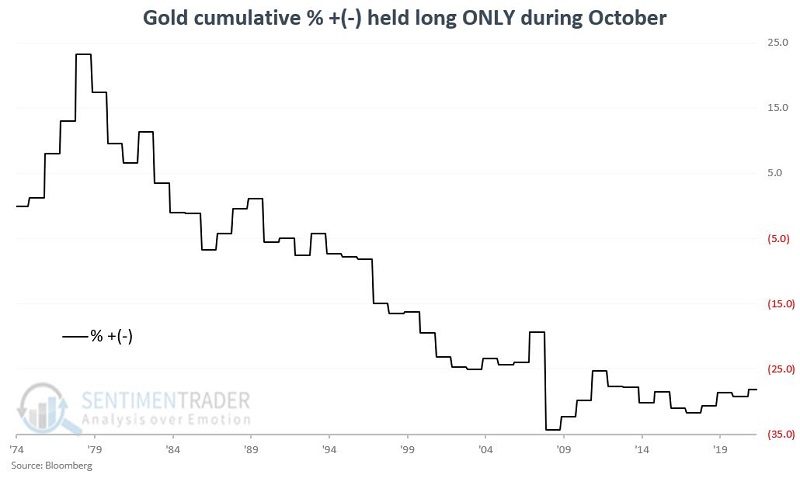
The chart below displays the cumulative return for gold if held only during October from 1975 through 2021. Sometimes up, sometimes down, but overall, generally not the ideal time to commit money to gold.
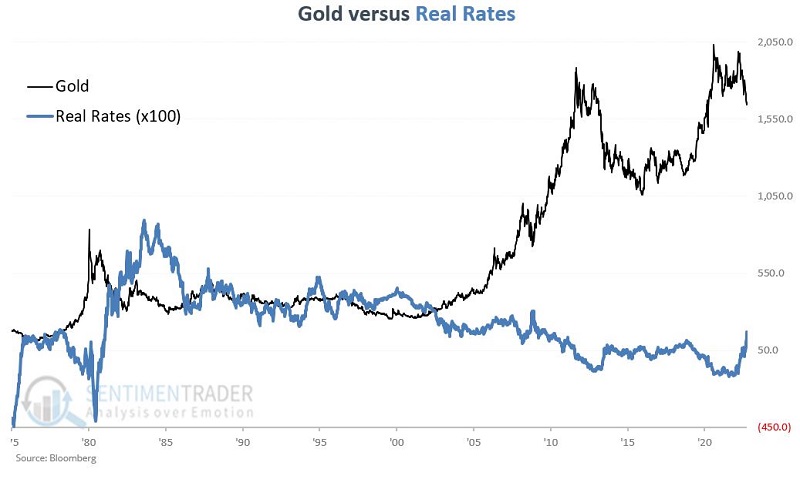
Real rates (defined here as the 10-year treasury yield minus 10-year inflation breakeven rate) are still posing a headwind as they have spiked recently. Gold tends to trade inversely to the trend in real rates, as shown in the chart below.
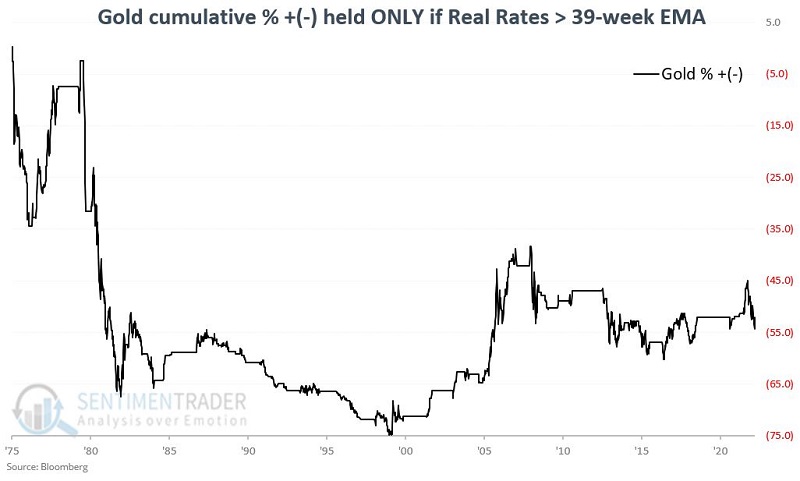
The chart below displays the cumulative return for gold when real rates are above their 39-week exponential average, which is currently the case. Gold did just fine in this environment during the mid-2000s, so it's not like the metal can't rally when real rates are rising, but once again, overall, generally not the ideal time to commit money to gold.
So there are some solid reasons why a trader might hesitate to jump on the latest rally in gold. Nevertheless, a compelling bullish case can also be made. Let's take a look at several bullish factors for gold.
Now, the good news
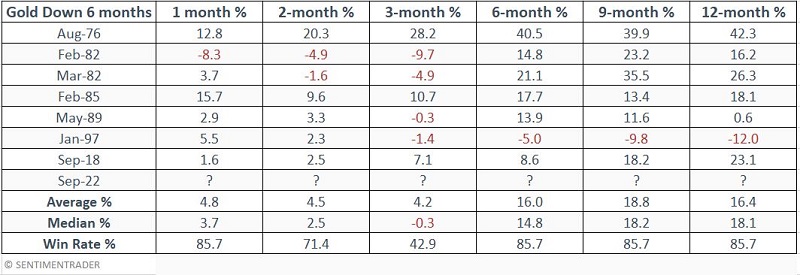
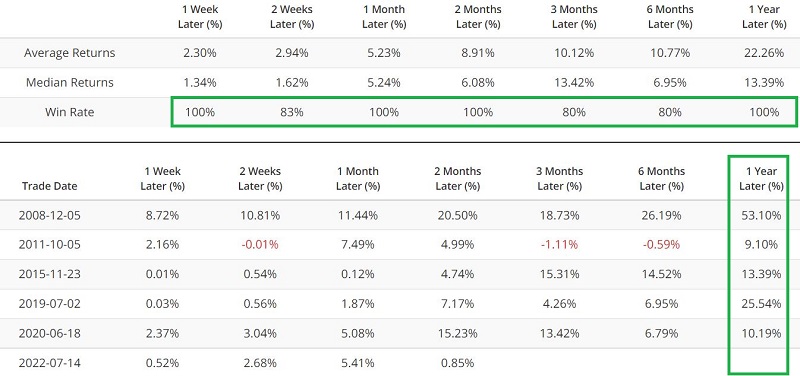
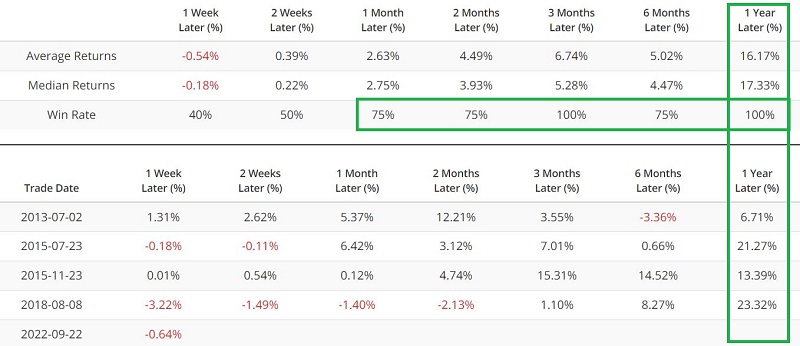
Gold has declined each of the past six months, which has only happened a handful of times since 1975. Higher gold prices typically followed.
The table below shows the other times this happened, including one overlapping signal when gold declined for a seventh month in 1982. Gold's returns in the months ahead were mainly excellent.
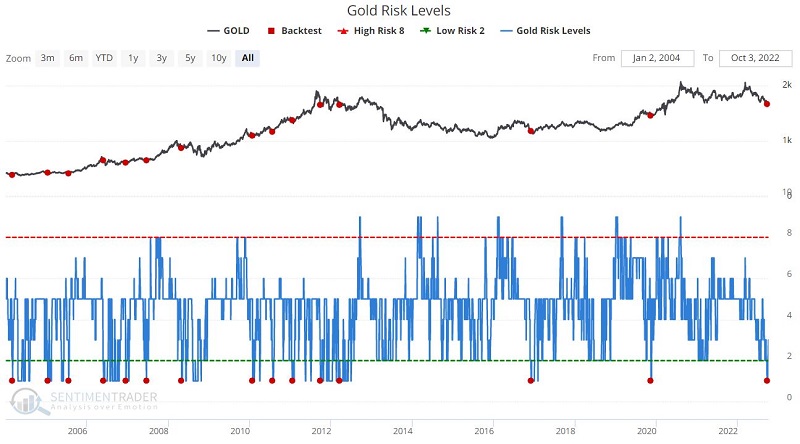
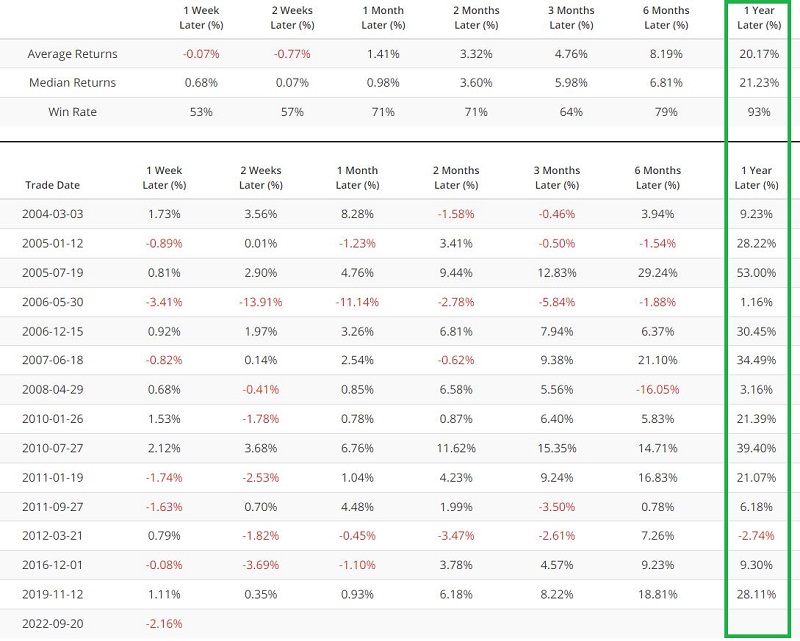
The chart below displays those times when our Gold Risk Level indicator dropped to 1 for the first time in six months, and the table summarizes subsequent gold performance. There was only a single loss over the following year.
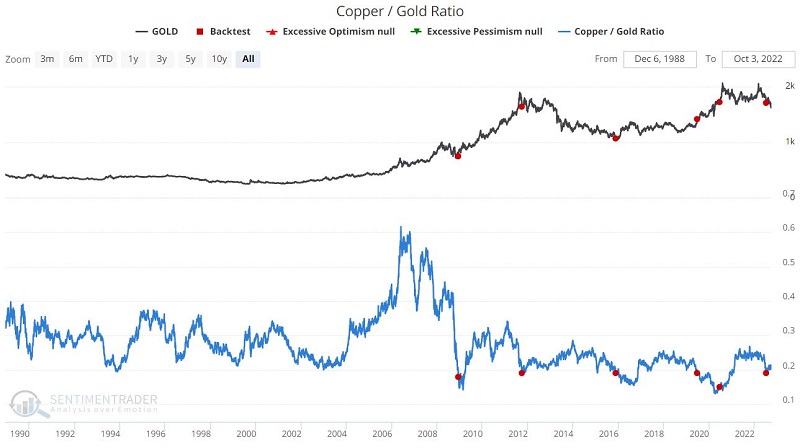
The chart below displays those times when our Copper/Gold Ratio dropped below 0.19. While the sample size is tiny, all signals preceded gains across most time frames.
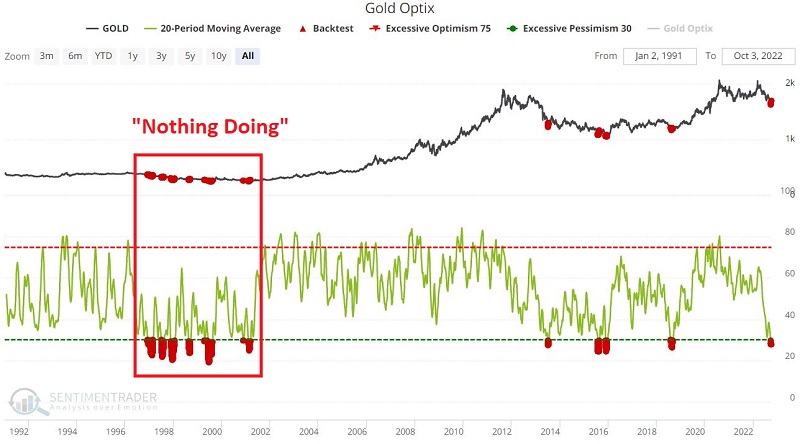
The Risk Level is based on historical performance after various tranches in the Optimism Index (Optix). Over the past 20 days, the Optix for gold has been exceptionally depressed.
The chart below displays those times when the 20-day moving average for Gold Optix dropped below 30, and the table summarizes subsequent gold performance. The results were lackluster, thanks mainly to the late 1990s.
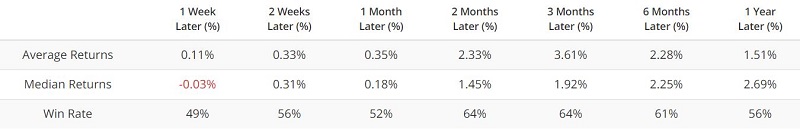
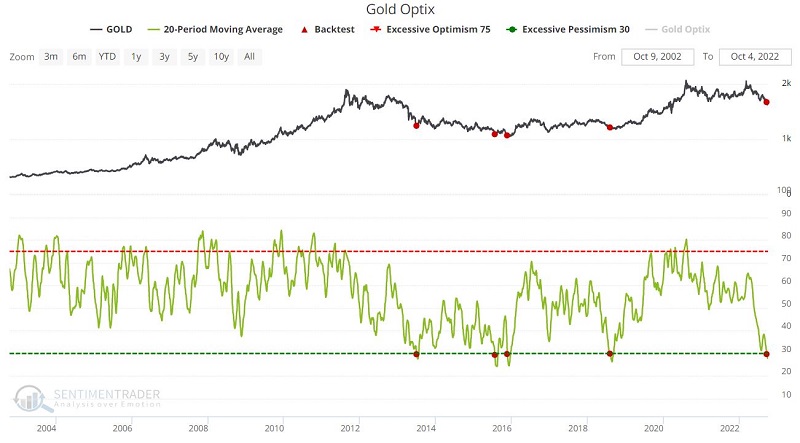
If we look only at results in the past 20 years, things have improved quite a bit, though there have only been a few precedents.
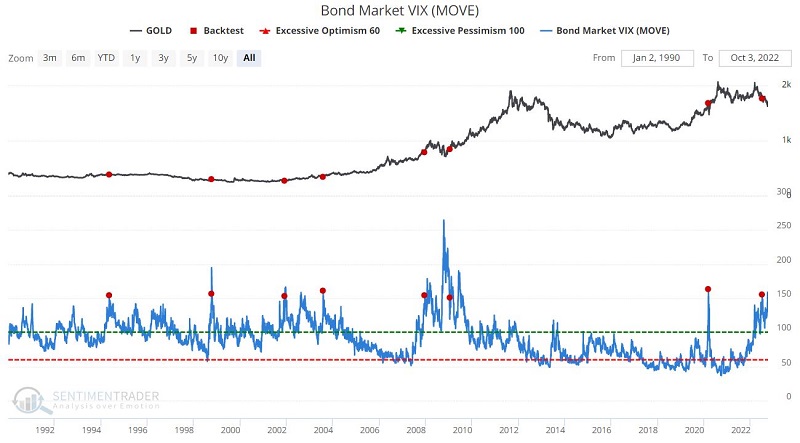
Along with most other assets, volatility in bonds has been very high. High volatility in bonds has tended to lead to good returns for gold.
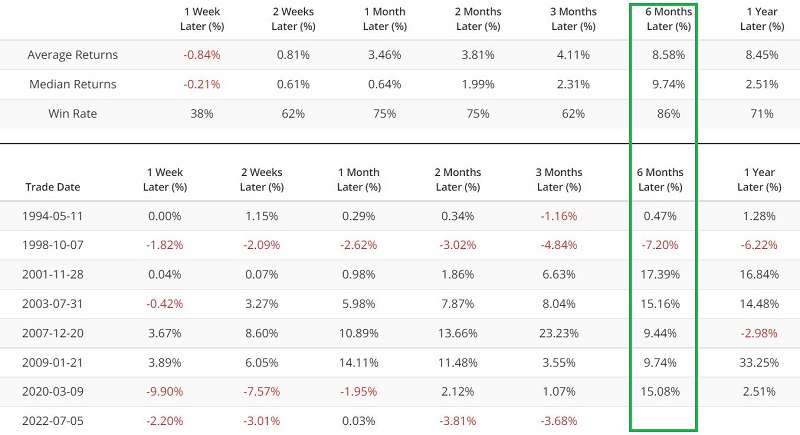
The chart below displays those times when Bond Market MOVE Index rose above 150 for the first time in 12 months, and the table summarizes subsequent gold performance.
What the research tells us…
October has a long history of being a volatile and often negative month for gold. History suggests it may be prudent to wait a bit longer before committing to the yellow metal. Nevertheless, several favorable factors are flashing green for a trader looking for a reason to buy gold.