
Gold and the dollar have danced like this only 9 times in history

Gold breaks out, shrugging off rising dollar
For over a year, gold hasn't gone anywhere. It peaked on a flurry of optimism last August and has struggled to hold any short-term rallies ever since. There is a sense of hope among gold bugs because after consolidating in a tight range, gold broke out above its weekly volatility bands.
A highly unusual circumstance we're seeing now is that gold is breaking out along with the dollar. In recent days, both markets have been hitting their highest levels in at least 90 days.
Since 1975, there has been a correlation of -0.31 (on a scale of -1.0 to +1.0) between daily changes in gold and the dollar. The correlation generally gets more negative as you expand the time frame. There have only been 9 other times when both markets hit a 90-day high at the same time.
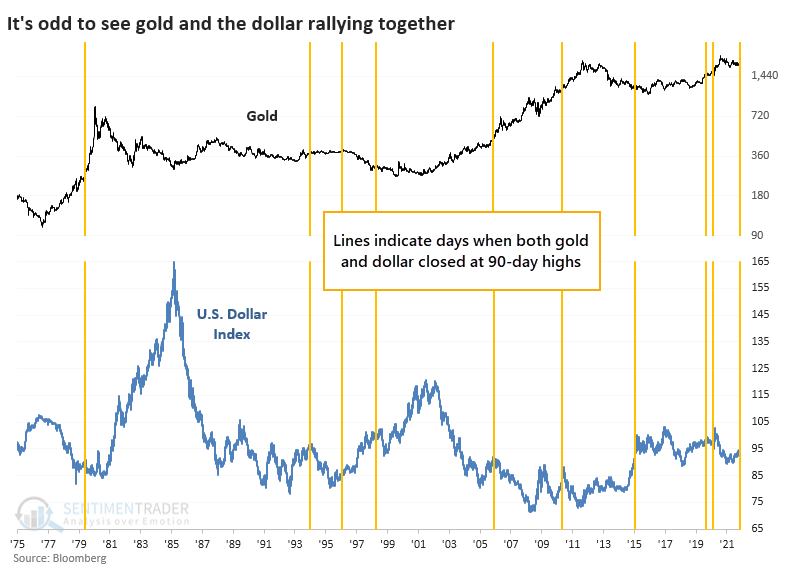
One might think that this would be wildly bullish for gold because it's shrugging off a historical relationship; one would be wrong. While gold's returns over the next 6-12 months were positive, it struggled to hold gains during the next 1-3 months.
Other indicators show a more promising outlook for the yellow metal, especially on longer time frames.

| Stat box More than 25% of Consumer Discretionary stocks are now overbought, according to their Relative Strength Index. All 4 times when so many stocks in this sector became overbought this year, the XLY fund declined over the next 2 weeks. |
Big tech strength continues
In a note last week, Dean shared a study that utilized the percentage of Nasdaq 100 (NDX) members in a correction to show a reversal in selling pressure with a 100% win rate.
With a reversal in the McClellan summation index, we now have an additional signal. When the NDX McClellan Summation Index crosses above 1000, after a reset below 0, performance was excellent.
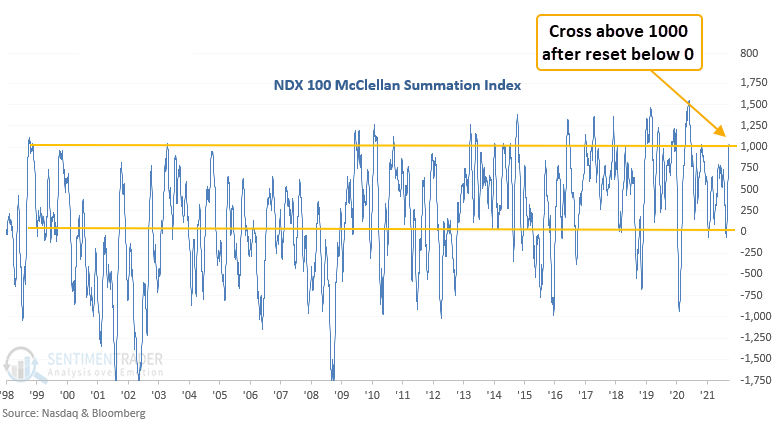
This signal has triggered 11 other times over the past 24 years.

Timing Large versus Small
There are many market rivalries - Stocks versus Bonds, Growth versus Value, Large-Cap versus Small-Cap. And there seems to be no end of people willing to argue for or against each rival.
No category of investment ever has a permanent edge. Period.
History is pretty clear on this. One style or sector leads the other lags, then just like that, it's all vice versa. The order of magnitude and the time required for a particular trend to play out can vary, but ultimately Ying follows Yang. Up follows down. Day follows night. Large-caps rule small-caps, and then they lag. And so on.
Jay took a closer look at how this works between large-cap and small-cap stocks using a specific switching strategy based on the calendar.
The chart below displays the growth of $1 achieved by investing in large-cap stocks during their favored periods and investing in small-cap stocks during their favored periods. The second line displays the growth of $1 split between large-cap and small-cap stocks on a buy-and-hold basis.
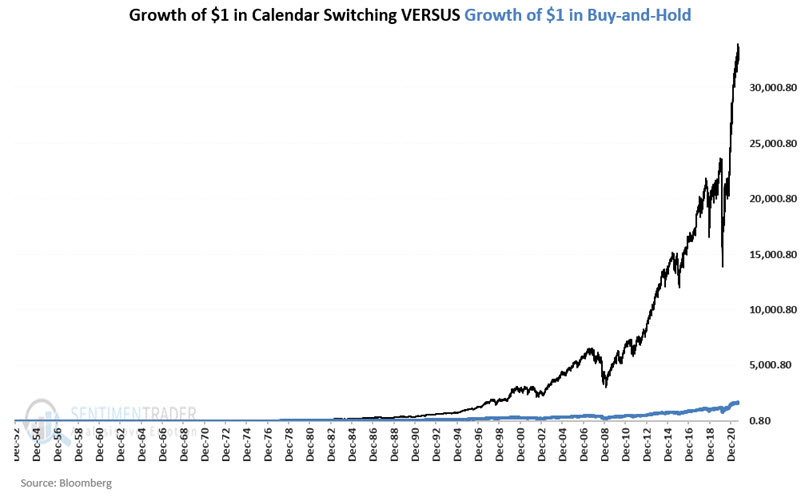
A $1 bet using the calendar switching strategy grew to $32,525 versus $1,601 using buy-and-hold.
