
Global Relative Trend Underperformance - From Signal to Trade

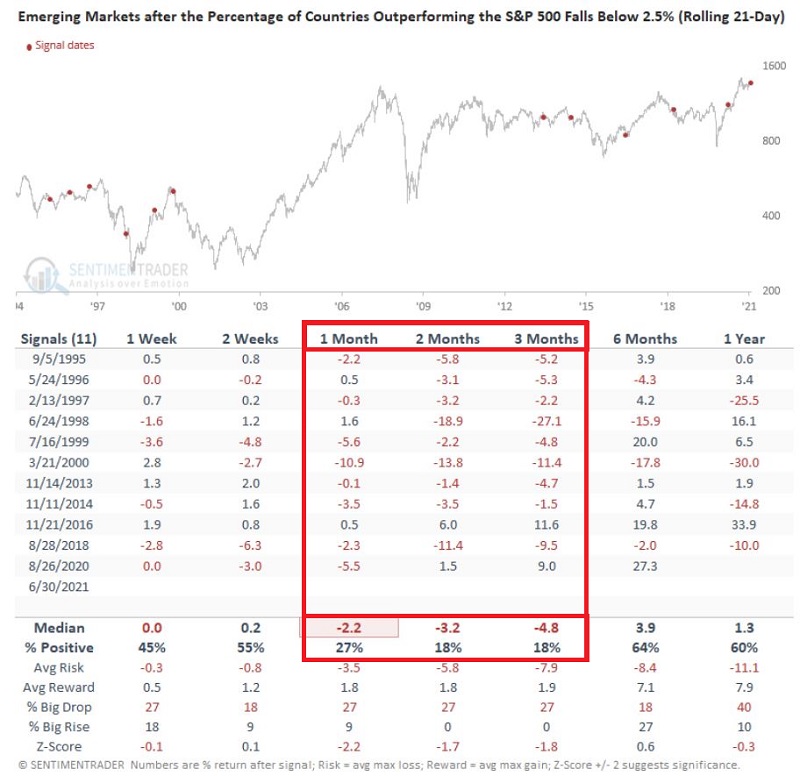
In this article on 7/7, Dean highlighted a signal that has historically had negative implications for Emerging Markets in the 2-3-month timeframe. The relevant numbers appear in the screenshot from that article below.
As you can see above, the first two weeks after a signal have been a coin flip. But the 1-, 2- and 3-month time frames have witnessed significantly below average results.
PLAYING THIS TREND
Ticker EEM (iShares MSCI Emerging Markets ETF) is an ETF that tracks the MSCI Emerging Markets Index. A trader who wanted to immediately put on a trade to potentially take advantage of any expected weakness in EEM in the next several months could buy the EEM Sep2021 55 put option.
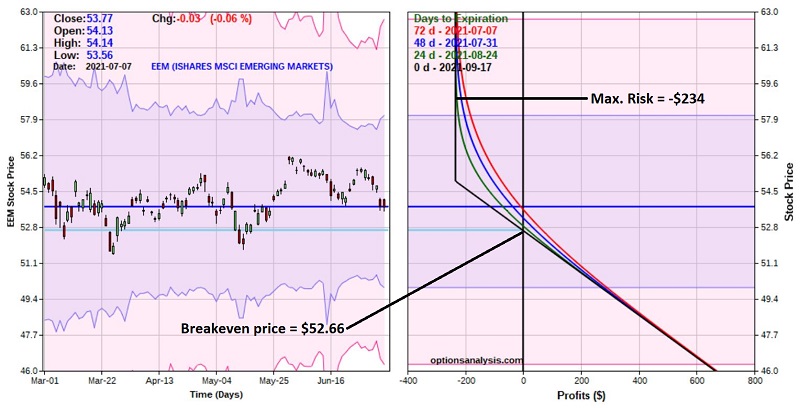
The figure below displays the particulars of the trade, and the chart below that (both courtesy of www.Optionsanalysis.com) displays the risk curves.
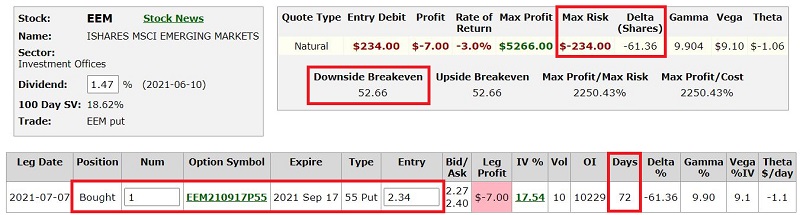
Things to note:
- This trade costs $234 per 1-lot to enter
- The option has a delta of -61.36 (this means that for each $1 decline in the price of EEM, the option would be expected to gain $61.36)
- The option has a gamma of 9.90 (this means that if EEM declines $1 decline in price, the position delta will change from -61.36 to -71.26)
- With EEM currently at $53.77 a share, the breakeven price at September options expiration is $52.66 (i.e., if the price off EEM does NOT decline between now and then, this trade WILL lose money)
As always, we do not offer investment advice, and the trade above constitutes merely one example of a way to play a bearish outlook for Emerging markets.
A CLOSER LOOK AT PRICE
As I like to say, one of my jobs is to help people "think like a trader." When we traders see what we perceive as a particularly bullish or bearish situation, we instinctively want to "act" right away. And not being shy about "pulling the trigger" on a trade is one of the requirements of being a successful trader. Still, not every situation calls for immediate action. To illustrate this possibility, let's take a closer look at EEM.
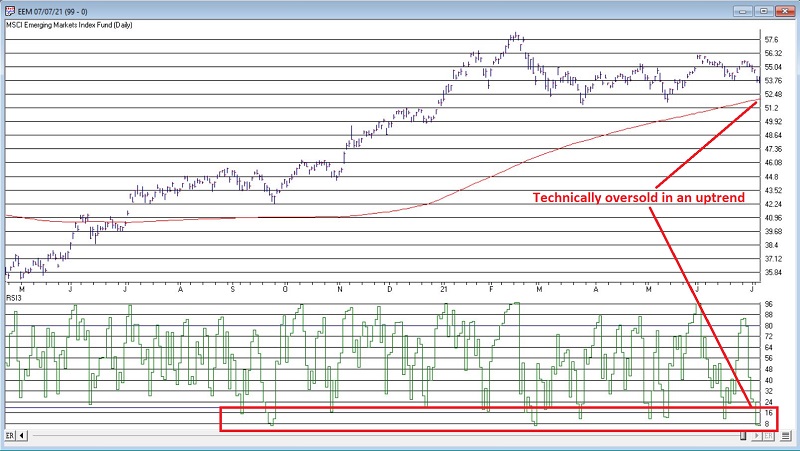
In the chart below (courtesy of AIQ TradingExpert), we can note two things:
- EEM technically remains in an "uptrend" - i.e., it is trading above its 200-day moving average
- The 4-day RSI is extremely oversold (at 6.61%)
Similar RSI pullbacks, while EEM is above its 200-day moving average, might easily be interpreted by some traders as a "bullish" signal.
If one's interpretation is that now is the time to get bearish on EEM, then the trade above can still make sense. But the information in the chart above might suggest that patience is in order and that a trader might wait for a better opportunity (i.e., after the next "bounce" in EEM, so that RSI is not in such an oversold configuration).
Likewise, it should be noted that this study flies directly in the face of a study done by Jason on a pattern that typically sees EEM rally in the months ahead.
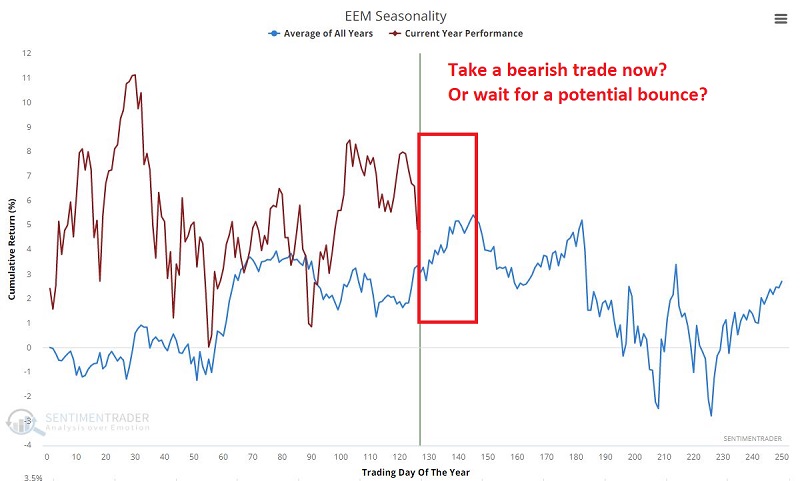
A CLOSER LOOK AT SEASONALITY
The chart below displays the Annual Seasonal Trend for ticker EEM.
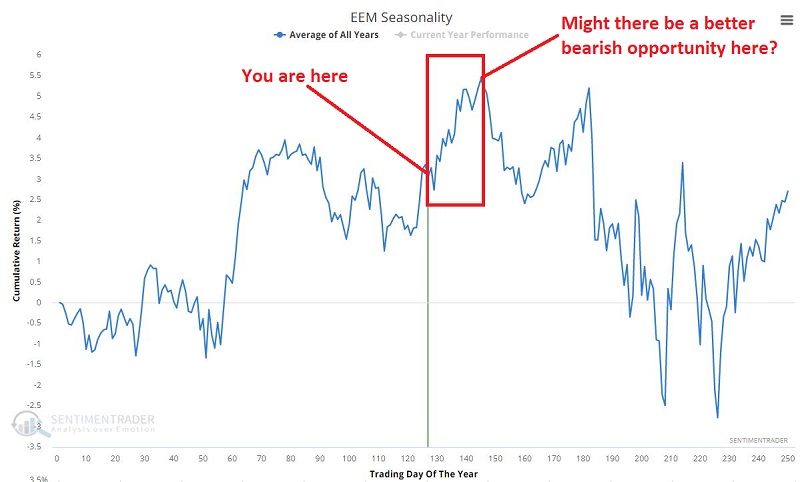
The key thing to note is that July tends to be one of the most favorable months of the year for EEM and that a period of typical strength lies directly ahead. The chart below shows that ticker EEM has tracked fairly closely with its seasonal tendencies so far in 2021.
THE FINAL ANALYSIS
If a trader determines that now is the time to act, then now is the time to act. And assuming the risk of $234 on a put option can allow a trader to take a position with defined maximum risk.
At the same time - in this particular situation - a trader might also resolve to keep a close eye for a peak in EEM seasonality before making a bearish play.
In fact, in the meantime, a trader might consider:
- The oversold RSI reading
- The oversold condition that Jason wrote about
- The favorable seasonal trend in the month ahead
Given all of the above, a bullish play "in the meantime" might also make sense.
These are the types of decisions each trader must make for themself.