
Global Relative Trend Buy Signal Concept

Each Monday, in my absolute and relative trend update note, I review how 44 individual countries compare to the S&P 500 using my composite relative trend model. The model contains ten trend-following indicators that measure whether the ratio between a country ETF and the S&P 500 ETF is rising or falling. A composite trend score above zero implies that a country ETF has a positive relative ratio trend. In contrast, a score below zero would indicate a negative relative ratio trend-the composite ranges from 10 highest to -10 lowest.
I'm a big fan of measuring the breadth of participation for data series as I believe the message from the troops is better than the message from the generals. If you've had a chance to read my Monday updates, you have seen the two-time series I created with the 44 country composite relative trend model data. The time series are the following.
- Percentage of countries with a positive relative trend score
- Percentage of countries with a relative trend score of -10
In the absolute and relative trend updates, I've shared annualized returns for the series based on bracket levels. i.e., if the percentage is below this level, then annualized returns are X%.
Today's note aims to share a concept that we can use to identify a hypothetical buy signal for each time series when the relative performance trend reverses direction from an extreme level.
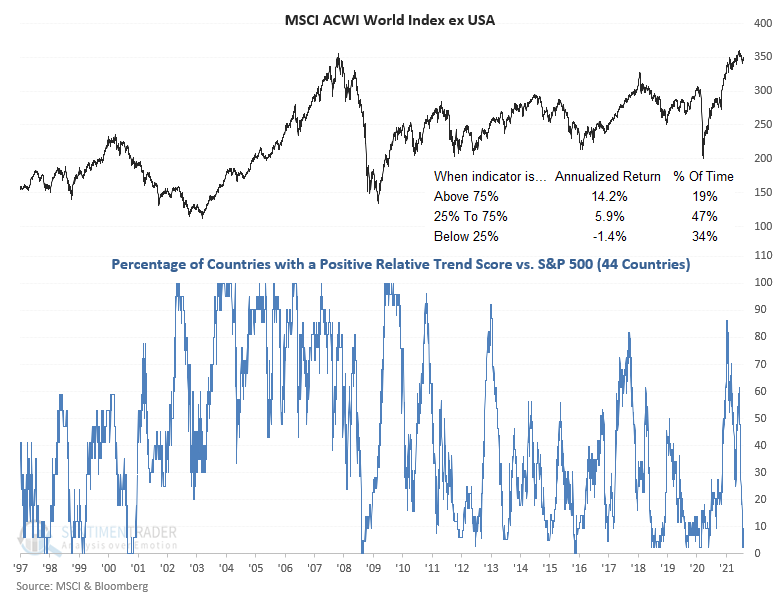
HISTORICAL CHART EXAMPLE SERIES #1
As the chart shows, the percentage of countries with a positive relative trend score versus the S&P 500 has reached one of the lowest levels in history.
THE CONCEPT
The percentage of countries with a positive relative trend score buy signal identifies when an N-day net change in the series crosses above a user-defined threshold after an oversold condition. Limiting the number of days in the net change calculation can identify a burst in participation that often leads to further price appreciation in the underlying index. The model will issue an alert based upon the following conditions.
SIGNAL CRITERIA
- The percentage of countries with a positive relative trend score crosses below 5%. i.e., the oversold reset condition
- If the reset condition is true and the 3-day net change in the percentage crosses above 15%, start days since true count.
- If days since true count <= 5 and the 5-day rate of change for the index is positive, then buy.
- The percentage of countries with a positive relative trend score crosses above 65%. i.e., the signal reset condition to screen out duplicates.
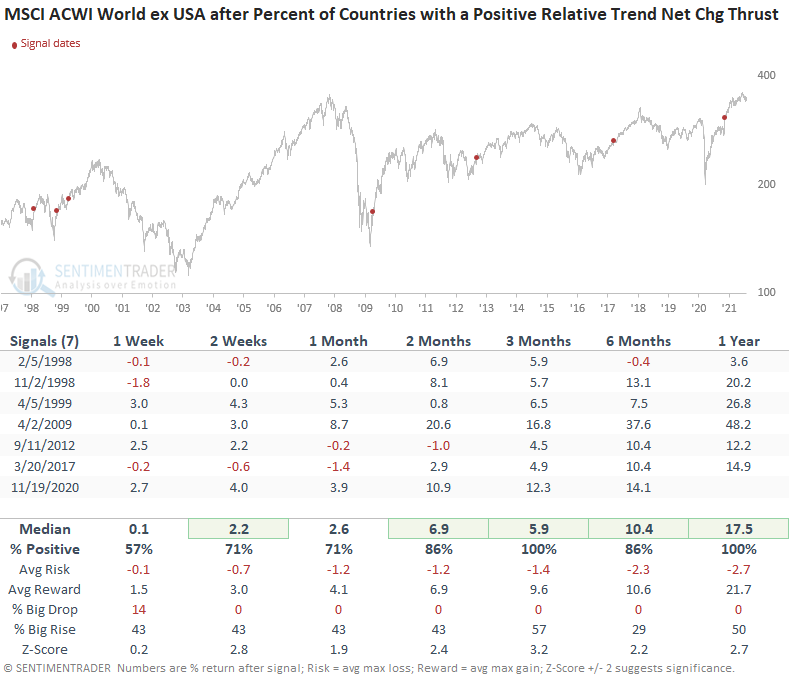
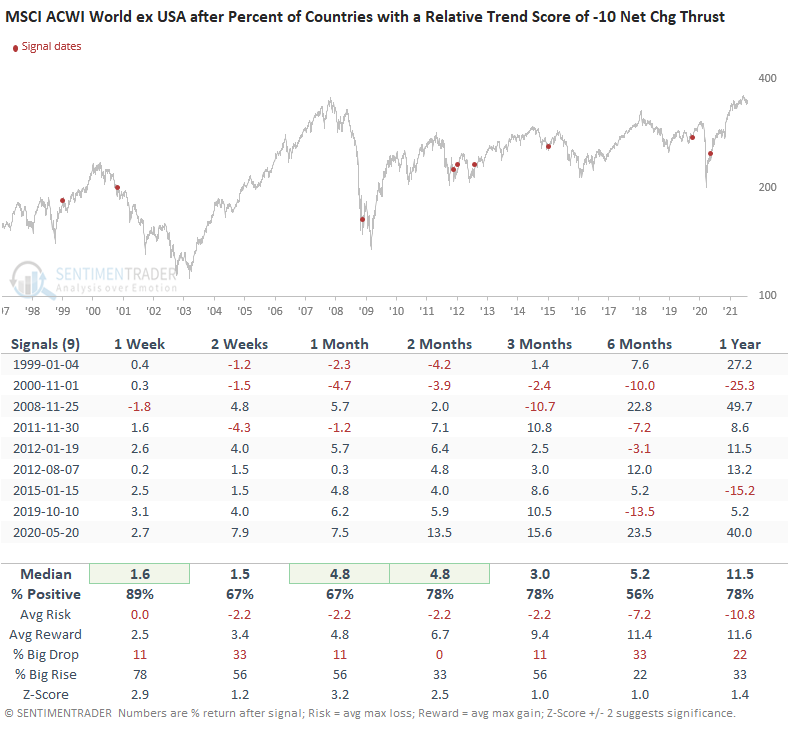
HOW THE SIGNALS PERFORMED
While the sample size is small, performance looks robust, especially in the 2-12 month timeframe.
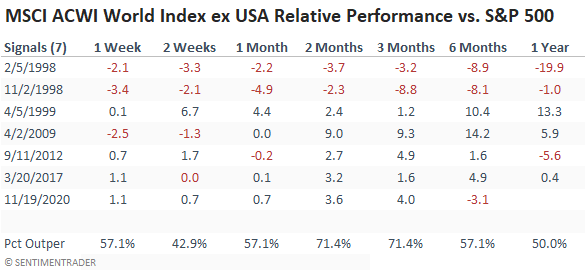
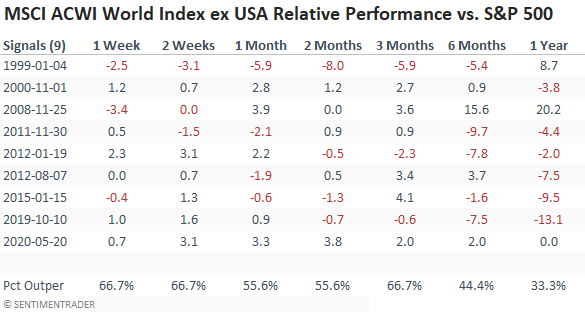
Relative performance looks good across most timeframes, especially in the 2-3 month window.
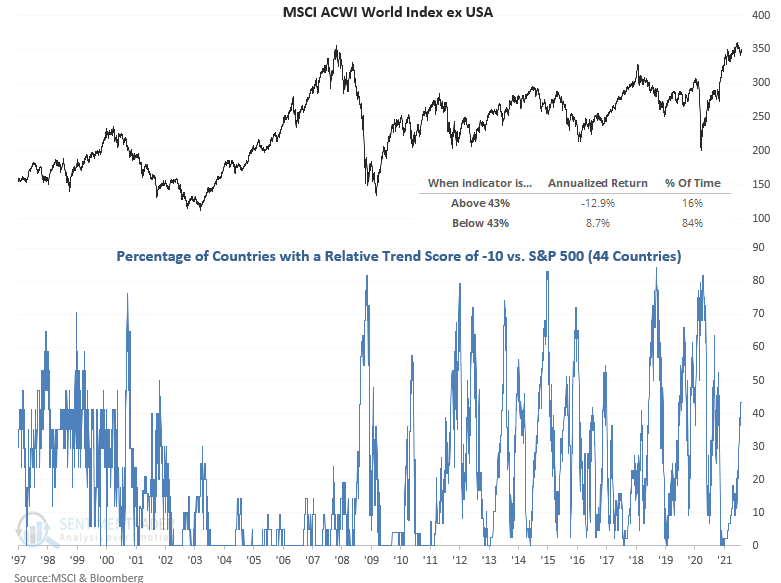
HISTORICAL CHART EXAMPLE SERIES #2
The percentage of countries with a relative trend score of -10 is rising toward the overbought reset condition level.
THE CONCEPT
The percentage of countries with a relative trend score of -10 buy signal identifies when an N-day net change in the percentage crosses below a user-defined threshold after an overbought condition. Limiting the number of days in the net change calculation can identify a burst in participation that often leads to further price appreciation in the underlying index. The model will issue an alert based upon the following conditions.
SIGNAL CRITERIA
- The percentage of countries with a relative trend score of -10 crosses above 65%. i.e., the overbought reset condition
- If the reset condition is true and the 3-day net change in the percentage crosses below -23%, start days since true count.
- If days since true count <= 5 and the 5-day rate of change for the index is positive, then buy.
- The percentage of countries with a relative trend score of -10 crosses below 10%. i.e., the signal reset condition to screen out duplicates.
You may notice that the concepts are the same. However, I reverse the parameters for the -10 series as the calculation for the indicator is different. i.e., the time series move in the opposite direction even though the message is similar.
HOW THE SIGNALS PERFORMED
The sample size for the second model contains a few more signals, and results look pretty good across most timeframes.
Relative performance looks good in the short to intermediate-term timeframes.
The first condition for the percentage of countries with a positive relative trend score is now confirmed. And, you can find updates to the series and signals in my Monday morning notes.