
Global Leading Economic Indicators Update

The composite leading indicators time series from the OECD is one of my favorite macro timing indicators for the stock market. Right about now, you think I'm crazy as the series operates with a lag and is revised each month. The fact that it lags and is revised is why I like it. The monthly LEI data provides a big-picture perspective that helps me block out all day-to-day noise and slow my process down. As a general rule, leading economic indicators provide the best risk/reward profile for the stock market when they increase from contraction territory. I would note that the LEI series is a component in the TCTM Composite Confirmation Model.
Let's review the LEI data with some tables, charts, and signals to see how the economic recovery is tracking through the lens of the stock market.
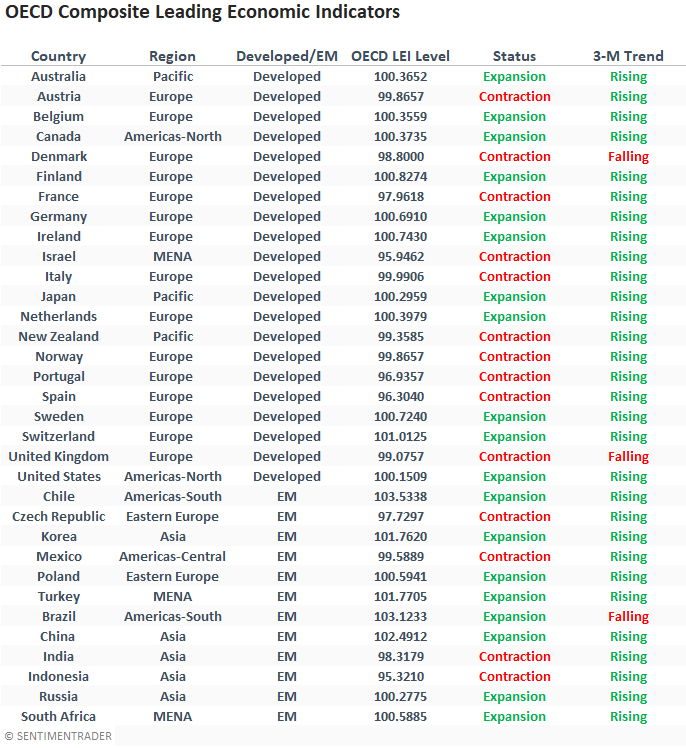
OECD COUNTRY DATA
As one can see, most countries maintain composite leading indicators that are rising in expansion territory. The United Kingdom and Denmark are bucking the trend with a contraction and a falling 3-month trend.
OECD LEI EXPANSION CHART
The following chart contains the percentage of countries in expansion territory. I would note that the indicator crossed above 50% at the end of February and has maintained that level with the March update and revisions.
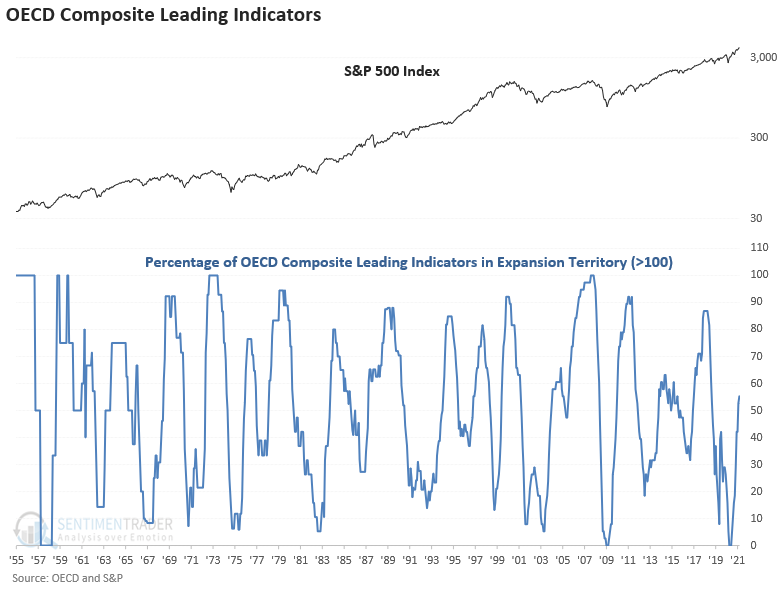
Let's see what happens if we buy the S&P 500 when the percentage of countries in expansion territory crosses above 50%.
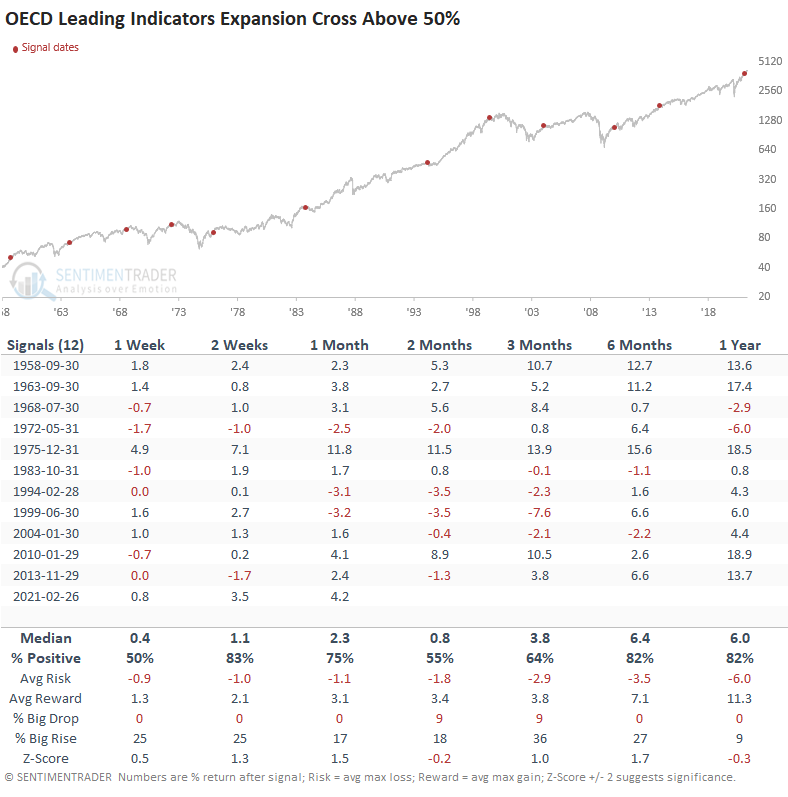
OECD LEI EXPANSION SIGNAL PERFORMANCE
Performance looks good. However, one can't rule out a pause to refresh in the 2-month timeframe.
Let's look at the method that I prefer to use to generate timing signals for the stock market.
OECD DIFFUSION CHART
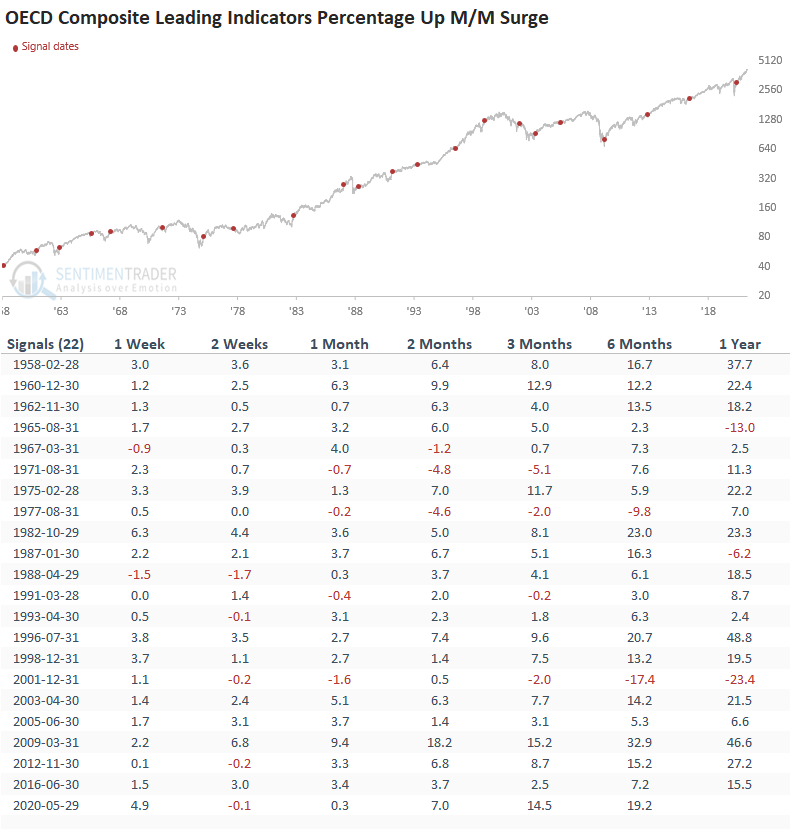
The following chart contains a diffusion index for the month-over-month change in the composite leading indicator series for over 40 countries. When a new economic recovery unfolds, the indicator will surge above 90% and maintain a high level for an extended period.
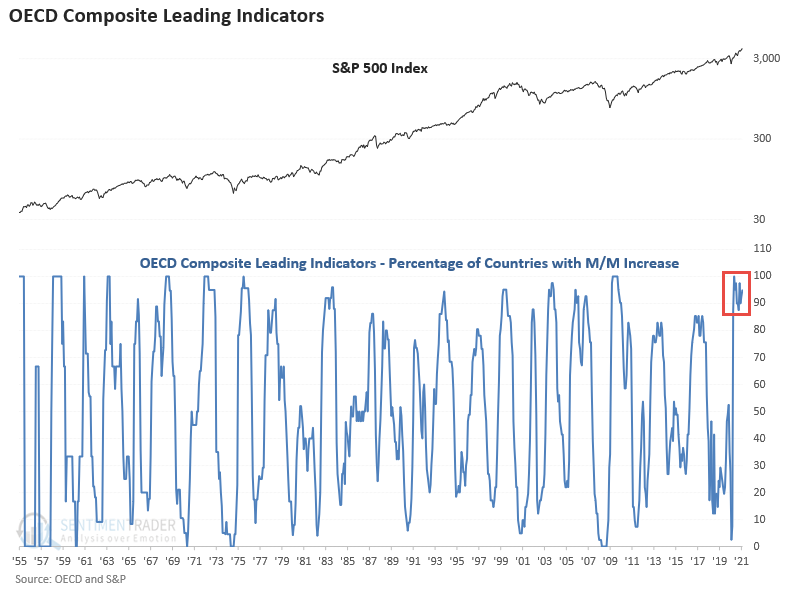
Historically, one can generate robust trading signals when a bearish to bullish reversal occurs. I use a cross above 60% with a rest below 40%. Let's take a look at the performance results.
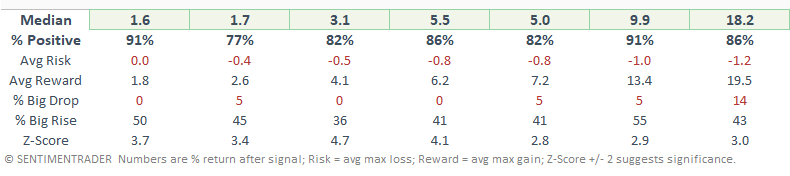
SIGNAL PERFORMANCE
As one can see, performance is robust across all timeframes.
DIFFUSION COUNT
As I stated above, the diffusion index will surge and maintain a high level after economic contractions. I created the following indicator to measure the number of months when the diffusion index held above 85% over an 18-month lookback period. The indicator allows me to compare and contrast historical cycles. The current economic recovery has now registered 11 months with a reading above 85%. In 1973, the diffusion index held above 85% for 14 months, the longest in history.
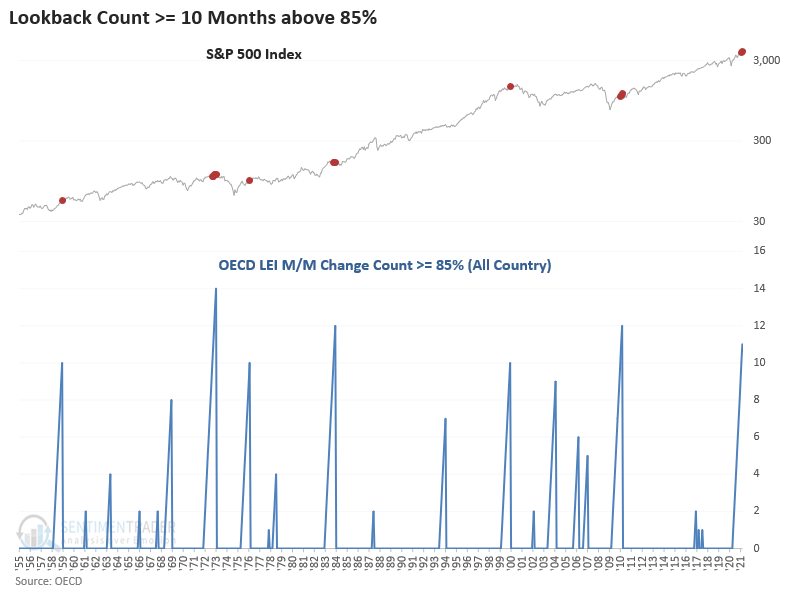
Let's look at what happens when the diffusion index streak above 85% comes to an end.
SIGNAL PERFORMANCE
While the sample size is small, performance is weak. I would classify this signal as an economic recovery hangover.
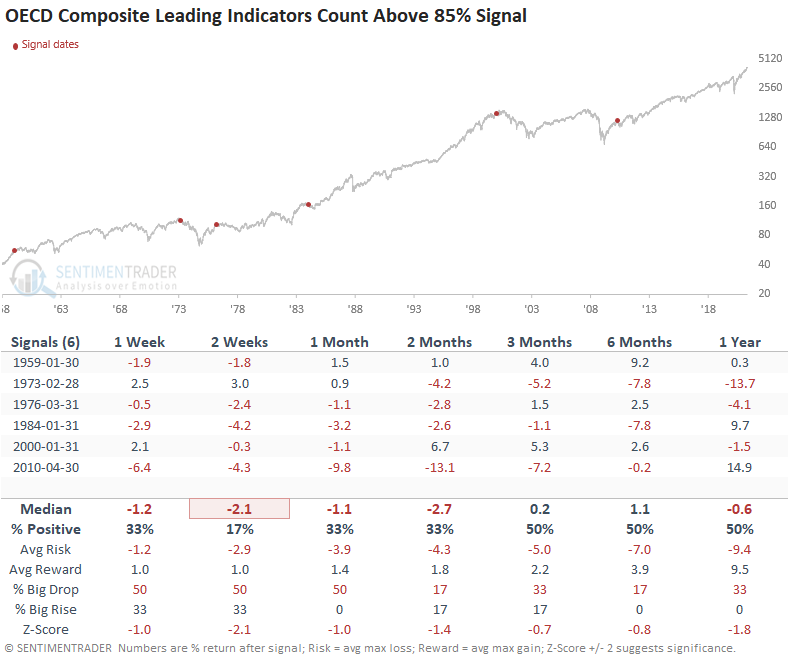
As long as the LEI data maintains a level above 85%, the backdrop for the stock market should remain constructive. I will be watching the diffusion count closely as it has reached a level that commands one's attention.