Products
SentimenTrader Trading Tools
‍
Backtest Engine
My Trading Toolkit
Correlation Analysis
Seasonality
Market Prediction
Indicators & Data API
‍
Proprietary Indicators & Charts
Market Data API
Strategies & Scanner
‍
50+ Trading Strategies
Smart Stock Scanner
Smart Option Scanner
Research Reports
‍
Research Solutions
Reports Library
Free Resources
Simple Backtest Calculator
Simple Seasonality Calculator
The Kelly Criterion Calculator
Sentiment Geo Map
Public Research Reports
Education
Sentiment Indicators
Technical Indicators
Pricing
Company
About
In the News
Testimonials
Client Success Stories
Contact
Log inLoginSign up
< BACK TO ALL REPORTS

Global Indexes are breaking down on a relative basis

Dean Christians
2023-05-31
A significant number of country ETFs are breaking down on a relative basis versus the S&P 500. The severe underperformance is remarkable in Europe, where every ETF closed at a 1-month relative low for the first time since November 2021. Historically, a high level of comparative breakdowns near a multi-month high has foreshadowed negative absolute returns.

Key points:

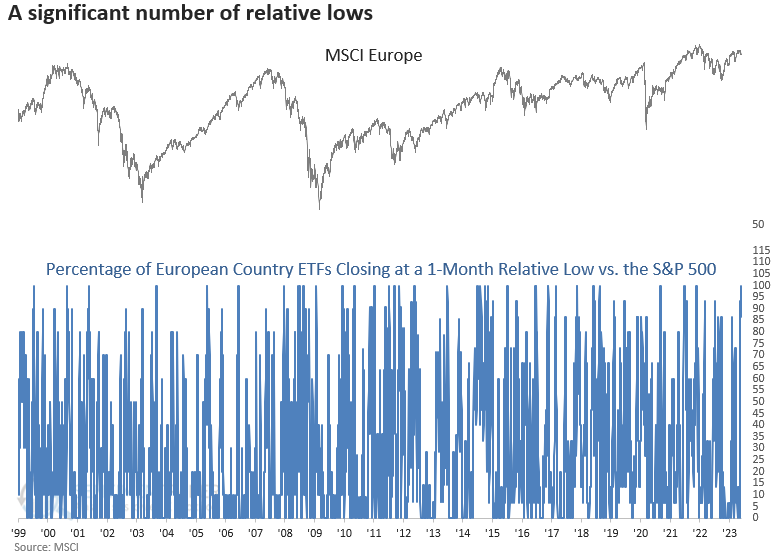
  • Every European country ETF closed at a 1-month relative low versus the S&P 500
  • Similar comparative breakdowns led to a near-term bounce that eventually failed
  • Across the globe, relative lows have surged to a level that suggests unfavorable returns

Global index trends are starting to deteriorate, especially in Europe

The current crowding into mega-cap growth-oriented stocks has made almost everything look unfavorable compared to the S&P 500, including global indexes, which hold a larger weighting in value-oriented stocks.

Europe, one of the more favorable regions around the globe, shows signs of fatigue.

On Tuesday, every European country ETF closed at a 1-month relative low versus the S&P 500. The surge in relative lows occurred with the MSCI Europe Index down less than 5% from a multi-month high.

The previous surge in relative lows near a high occurred in November 2021, which was an ominous sign.

Similar comparative breakdowns led to a bounce that typically failed

When every European country ETF registers a 1-month relative low versus the S&P 500 near a high, the MSCI Europe Index tends to bounce soon. However, after a few weeks, the rally falters, with negative returns over the next one to three months. Even a year later, results are not exactly encouraging.

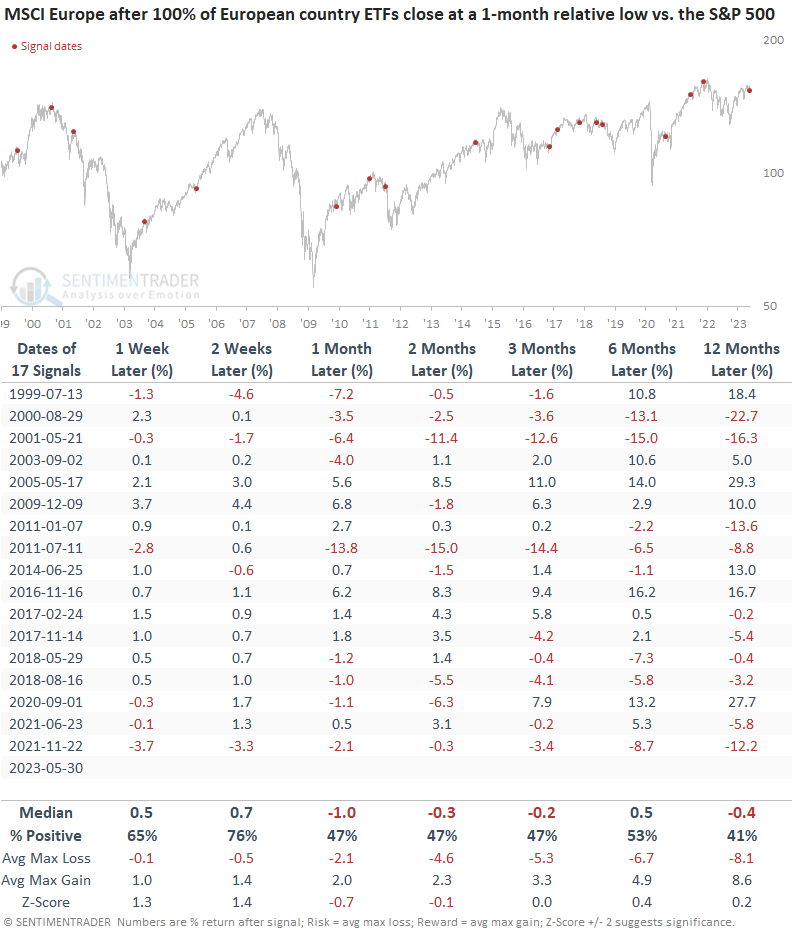
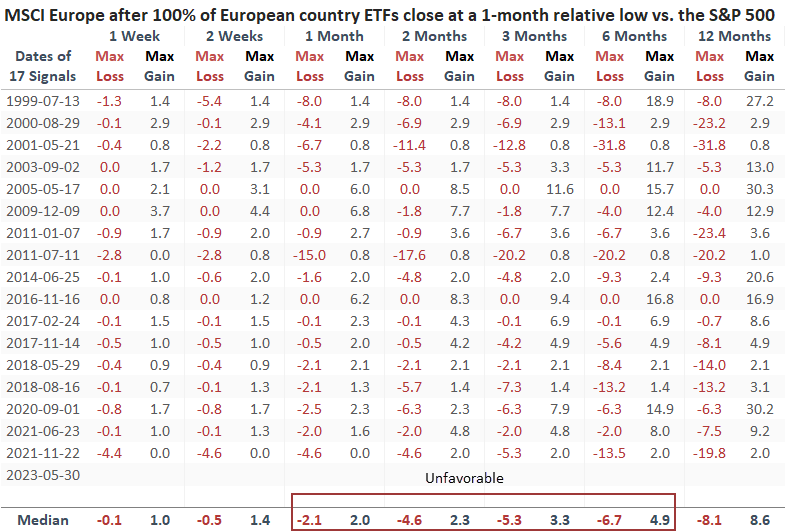
The median max loss exceeds the median max gain from one to six months later. And a year later, it's barely favorable.

Almost everything is breaking down relative to the S&P 500

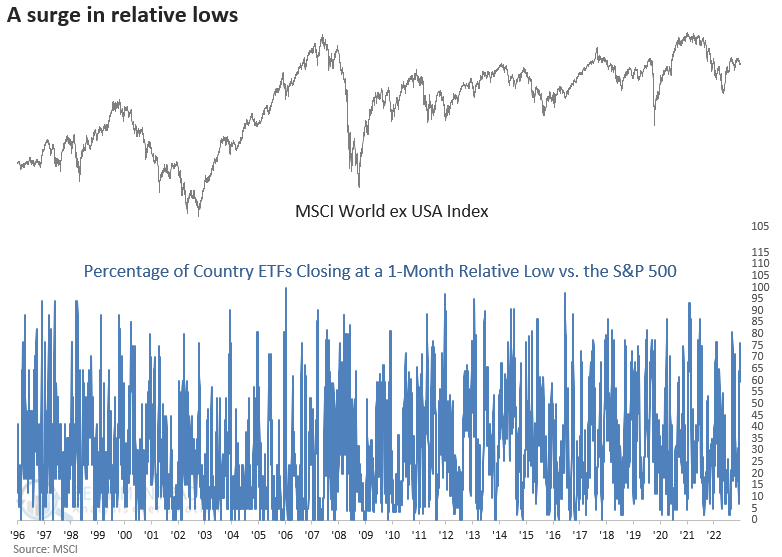
The relative breakdown versus the S&P 500 is a global phenomenon, with over 75% of countries registering a 1-month relative low. And in most cases, a cluster of lows has been triggered over the last five sessions.

Some countries we highlighted recently with bullish trends, like Japan and Brazil, have not broken down on a relative basis.

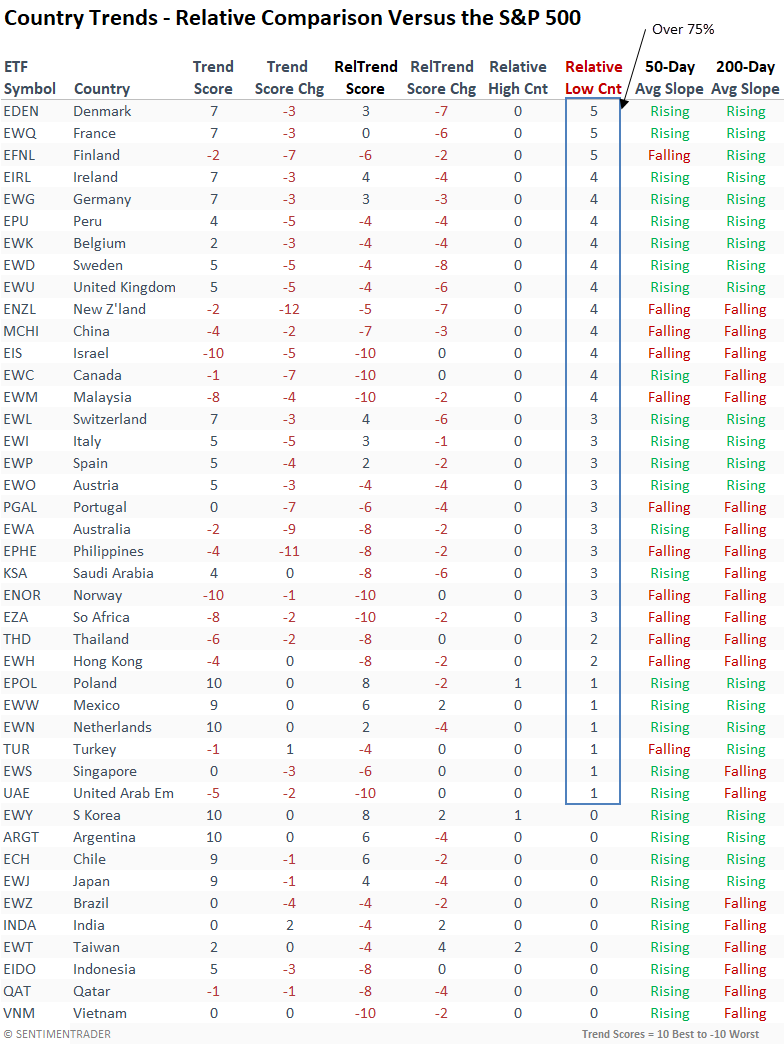
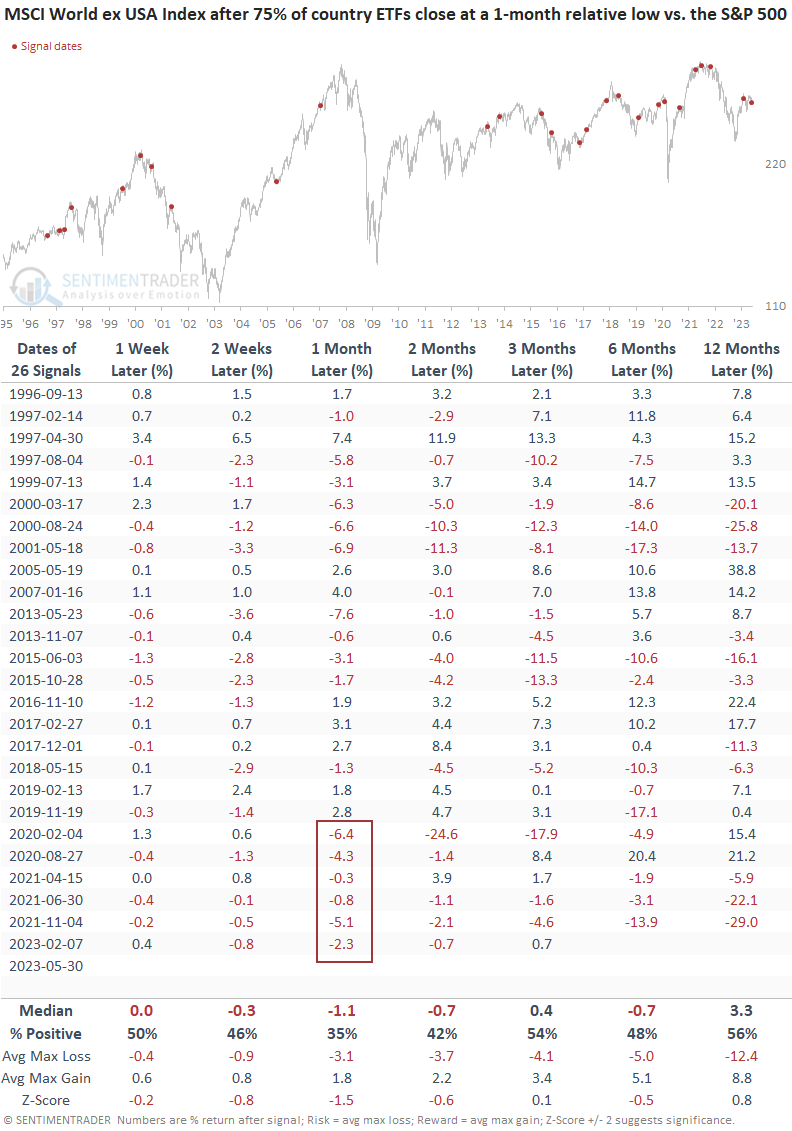
More than 75% of country ETFs closed at a 1-month relative low, with the MSCI World ex USA Index within 5% of a multi-month high.

Similar relative low surges led to mostly negative returns 

The severe relative breakdown for country ETFs near a high does not bode well for the MSCI World ex USA Index over the next six months.  Unlike Europe, the odds of a short-term relief rally don't look good. A month later, the global index was lower 65% of the time.

What the research tells us...

With meg-cap growth-oriented stocks, which dominate the weightings in the S&P 500 significantly outperforming the average stock, it's not surprising to see global indexes, which lean toward value, break down on a comparative basis. However, the magnitude of relative underperformance is so severe that it typically leads to unfavorable absolute returns. After similar surges in comparative lows, global indexes could struggle over the next one to six months. 

PRODUCTS
SentimenTrader
Trading Tools
Indicators & Data API
‍
Strategies & Scanner
‍
Research Reports
FREE
RESOUrCES
Simple Backtest
Calculator
Simple Seasonality
Calculator
The Kelly Criterion
Calculator
Sentiment Geo Map
‍
Public Research Reports
‍
Education
Sentiment Indicators
‍
Technical Indicators
‍
Pricing
Bundle pricing
‍
FAQ
‍
Announcements
‍
COMPANY
‍
About
‍
In the News
‍
Testimonials
‍
Client Success Stories
CONTACT
‍
General Inquiries
‍
Media Inquiries
‍
Financial Professionals Inquiries
‍
© 2026 Sundial Capital Research Inc. All rights reserved.
Setsail Marketing
TermsPrivacyAffiliate Program
Risk Disclosure: The information and tools provided are for research and analytical purposes only and are not intended as investment advice. Market analysis involves uncertainty, and outcomes may differ from expectations. Users should conduct their own due diligence and consider their individual circumstances before making any financial decisions. Past performance is not necessarily indicative of future results.

Hypothetical Performance Disclosure: Hypothetical performance results have many inherent limitations, some of which are described below. No representation is being made that any account will or is likely to achieve profits or losses similar to those shown; in fact, there are frequently sharp differences between hypothetical performance results and the actual results subsequently achieved by any particular trading program. One of the limitations of hypothetical performance results is that they are generally prepared with the benefit of hindsight. In addition, hypothetical trading does not involve financial risk, and no hypothetical trading record can completely account for the impact of financial risk of actual trading. for example, the ability to withstand losses or to adhere to a particular trading program in spite of trading losses are material points which can also adversely affect actual trading results. There are numerous other factors related to the markets in general or to the implementation of any specific trading program which cannot be fully accounted for in the preparation of hypothetical performance results and all which can adversely affect trading results.

Testimonial Disclosure: Testimonials appearing on this website may not be representative of other clients or customers and is not a guarantee of future performance or success.