Data &
Technology
Research
Reports
Report Solutions
Reports Library
Actionable
Strategies
Free
Resources
Simple Backtest Calculator
Simple Seasonality Calculator
The Kelly Criterion Calculator
Sentiment Geo Map
Public Research Reports
Free Webinar
Pricing
Company
About
Meet Our Team
In the News
Testimonials
Client Success Stories
Contact
Log inLoginSign up
< BACK TO ALL REPORTS

Getting Out When Averages Cross

Jason Goepfert
2016-03-01
null

Basic, long-term trend-following systems have become all the rage. Backtested results show that owning stocks, or almost any other asset class, when they are above a long-term moving average (such as 10 or 12 months), and not owning them when below the average, is superior on a risk-adjusted basis to simply buying and holding those assets.

Unfortunately for adherents, when a simple strategy gains popularity, triggering assets in ETFs dedicated to the strategy, it's usually bound to stop working like it did in the past.

Another one that has been making the rounds is that when the 10-month moving average of the S&P has fallen below the 20-month, it preceded the worst losses of the last two bear markets, as published by MarketWatch.

We often discuss how various behavioral biases impact sentiment, and recency bias, or fighting the last battle, is among the most nefarious. Most of those managing investments today lived through at least the last bear market, and usually the last two. That's what has imprinted, and that's what they measure patterns against. Those time periods are also historical outliers that are unlikely to repeat in a similar fashion in the near future.

But that's just opinion. Let's look at the facts. Here is how we would have done if we sold short the S&P 500 when the 10-month average crossed below the 20-month average. Note that this is being generous, because it's assuming that we were watching the market on the last day of the month and sold when it looked apparent that the averages would cross.

Remember, these are results from selling short, so a positive return means that stocks declined, and a negative return means that stocks rallied.

20160301_signal_table

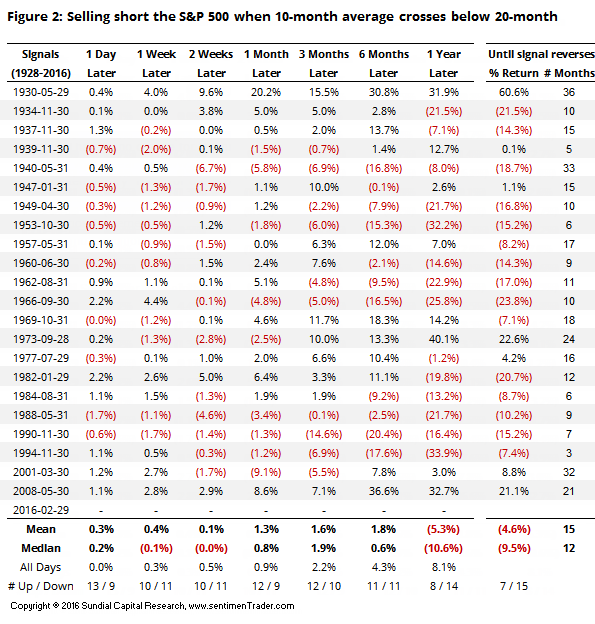
As bears are eager to point out, it did great in 2008. Selling short would have been a wonderful strategy. That wasn't so much the case in 2001, as we would have lost nearly 10% when stocks rallied over the next month. Would we have been able to stick with our short position at the time?

This strategy also did well in 1930 and a few times when markets underwent wide swings around the 1970s. That's assuming we knew when to get out, however. If we had waited until the signal reversed (when the 10-month average crossed above the 20-month average), then we would have taken a loss on our short position 15 out of 22 times, holding the trades for an average of 12 months.

In any time frame, does it make sense for a typical long-oriented investor to worry about this signal? Perhaps over the next 1- to 3-months. Then, the short position showed a gain 12 times and actually sported a positive return (meaning stocks declined). But when it didn't work and stocks rallied, they rallied hard seven times, which would be tough to stomach if one is sitting in cash waiting for this signal to play out.

DATA &
TECHnologies
IndicatorEdge
‍
BackTestEdge
‍
Other Tools
‍
DataEdge API
RESEARCH
reports
Research Solution
‍
Reports Library
‍
actionable
Strategies
Trading Strategies
‍
Smart Stock Scanner
‍
FREE
RESOUrCES
Simple Backtest
Calculator
Simple Seasonality
Calculator
The Kelly Criterion
Calculator
Sentiment Geo Map
‍
Public Research Reports
‍
Free Webinar
COMPANY
‍
About
‍
Meet our Team
‍
In the News
‍
Testimonials
‍
Client Success Stories
Pricing
Bundle pricing
‍
Announcements
‍
FAQ
© 2024 Sundial Capital Research Inc. All rights reserved.
Setsail Marketing
TermsPrivacyAffiliate Program
Risk Disclosure: Futures and forex trading contains substantial risk and is not for every investor. An investor could potentially lose all or more than the initial investment. Risk capital is money that can be lost without jeopardizing ones’ financial security or life style. Only risk capital should be used for trading and only those with sufficient risk capital should consider trading. Past performance is not necessarily indicative of future results.

Hypothetical Performance Disclosure: Hypothetical performance results have many inherent limitations, some of which are described below. No representation is being made that any account will or is likely to achieve profits or losses similar to those shown; in fact, there are frequently sharp differences between hypothetical performance results and the actual results subsequently achieved by any particular trading program. One of the limitations of hypothetical performance results is that they are generally prepared with the benefit of hindsight. In addition, hypothetical trading does not involve financial risk, and no hypothetical trading record can completely account for the impact of financial risk of actual trading. for example, the ability to withstand losses or to adhere to a particular trading program in spite of trading losses are material points which can also adversely affect actual trading results. There are numerous other factors related to the markets in general or to the implementation of any specific trading program which cannot be fully accounted for in the preparation of hypothetical performance results and all which can adversely affect trading results.

Testimonial Disclosure: Testimonials appearing on this website may not be representative of other clients or customers and is not a guarantee of future performance or success.