Products
SentimenTrader Trading Tools
‍
Backtest Engine
My Trading Toolkit
Correlation Analysis
Seasonality
Market Prediction
Indicators & Data API
‍
Proprietary Indicators & Charts
Market Data API
Strategies & Scanner
‍
50+ Trading Strategies
Smart Stock Scanner
Smart Option Scanner
Research Reports
‍
Research Solutions
Reports Library
Free Resources
Simple Backtest Calculator
Simple Seasonality Calculator
The Kelly Criterion Calculator
Sentiment Geo Map
Public Research Reports
Education
Sentiment Indicators
Technical Indicators
Pricing
Company
About
In the News
Testimonials
Client Success Stories
Contact
Log inLoginSign up
< BACK TO ALL REPORTS

Gapping Up On Nonfarm Payrolls

Jason Goepfert
2016-03-04
null

Stock futures are indicated to gap open at least 0.5% as the Nonfarm Payroll (NFP) number exceeded estimates, and for the moment, traders are taking that as a good sign. It could change dramatically before the actual open.

We've often discussed in the past how extreme reactions to the NFP number coincide with short-term extremes in stocks, especially when stocks have been at or near a price extreme. A gap of 0.5% or so isn't exactly "extreme" but it's coming on the heels of excellent gains over the past few weeks.

When the S&P 500 fund, SPY, gapped up at least 0.5% on NFP day after already having rallied at least 5% in the prior three weeks, it tended to lead to weakness over the next 3-5 days (buying the open of NFP day):

20160304_nfp

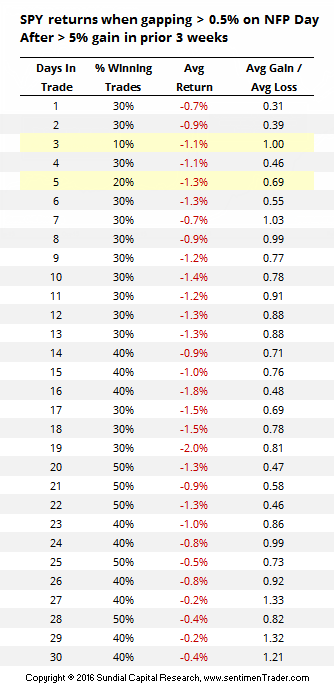
From Friday's open through the close on Wednesday, 9 out of 10 trades were losers, averaging -1.1%. The sole winner was in March 2011 as stocks were coming out of a decline, and it led to even more gains over the next two months. As we've been harping on in the Daily Report, a market that doesn't do what it should in the short-term typically keeps doing it over the following weeks.

A sample size of 10 is awfully small, so if we adjust the parameters to get more precedents, the overall tendency stays the same. If we require only a 3% rally, then over the next 3 days 14 out of 16 traders were losers. A rally of any size led to 58% losing trades. If we look for a gap up of any size when the S&P was below its 200-day average, then 14 out of 19 trades were losers.

The bottom line is that with a plethora of short-term sentiment extremes, a seasonal soft spot after the first few days of March and typical reactions from gap ups on NFP days, the risk/reward into mid-week next week is tilted to the downside.


PRODUCTS
SentimenTrader
Trading Tools
Indicators & Data API
‍
Strategies & Scanner
‍
Research Reports
FREE
RESOUrCES
Simple Backtest
Calculator
Simple Seasonality
Calculator
The Kelly Criterion
Calculator
Sentiment Geo Map
‍
Public Research Reports
‍
Education
Sentiment Indicators
‍
Technical Indicators
‍
Pricing
Bundle pricing
‍
FAQ
‍
Announcements
‍
COMPANY
‍
About
‍
In the News
‍
Testimonials
‍
Client Success Stories
CONTACT
‍
General Inquiries
‍
Media Inquiries
‍
Financial Professionals Inquiries
‍
© 2026 Sundial Capital Research Inc. All rights reserved.
Setsail Marketing
TermsPrivacyAffiliate Program
Risk Disclosure: The information and tools provided are for research and analytical purposes only and are not intended as investment advice. Market analysis involves uncertainty, and outcomes may differ from expectations. Users should conduct their own due diligence and consider their individual circumstances before making any financial decisions. Past performance is not necessarily indicative of future results.

Hypothetical Performance Disclosure: Hypothetical performance results have many inherent limitations, some of which are described below. No representation is being made that any account will or is likely to achieve profits or losses similar to those shown; in fact, there are frequently sharp differences between hypothetical performance results and the actual results subsequently achieved by any particular trading program. One of the limitations of hypothetical performance results is that they are generally prepared with the benefit of hindsight. In addition, hypothetical trading does not involve financial risk, and no hypothetical trading record can completely account for the impact of financial risk of actual trading. for example, the ability to withstand losses or to adhere to a particular trading program in spite of trading losses are material points which can also adversely affect actual trading results. There are numerous other factors related to the markets in general or to the implementation of any specific trading program which cannot be fully accounted for in the preparation of hypothetical performance results and all which can adversely affect trading results.

Testimonial Disclosure: Testimonials appearing on this website may not be representative of other clients or customers and is not a guarantee of future performance or success.