
Gamma exposure crosses another key level

Key points
- Gamma exposure as a percentage of market capitalization has crossed two significant levels recently
- This indicator and the signals given do not constitute a trading system or an automatic trading system
- Still, stock market performance following previous signals has been notably favorable
Gamma exposure crossed a significant threshold earlier
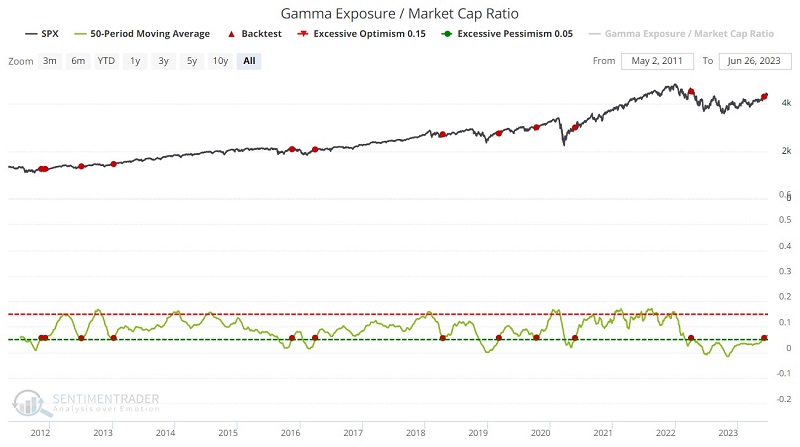
Gamma exposure refers to the sensitivity of existing options contracts to changes in the underlying price of the S&P 500. A raw gamma exposure value of 6 billion implies that if the price moves +/-1%, 6 billion shares will come to market to push price in the opposite of the prevailing direction. The Gamma Exposure / Market Cap Ratio indicator expresses the raw gamma exposure value as a percentage of total stock market capitalization.
Technical jargon aside, the highest values tend to occur as prices peak and the lowest values as prices bottom. Another helpful way to apply this data for trading is to watch for a rise from a low value as a sign of a potentially favorable shift in trader sentiment from bearish to bullish.
The first signal occurred on 2023-06-06 and was highlighted in an earlier piece a few weeks ago. The red dots in the chart below highlight those dates when the 50-day average of the Gamma Exposure / Market Cap Ratio indicator crossed above 0.05. The table summarizes the subsequent S&P 500 Index performance.

Gamma exposure crosses another significant threshold
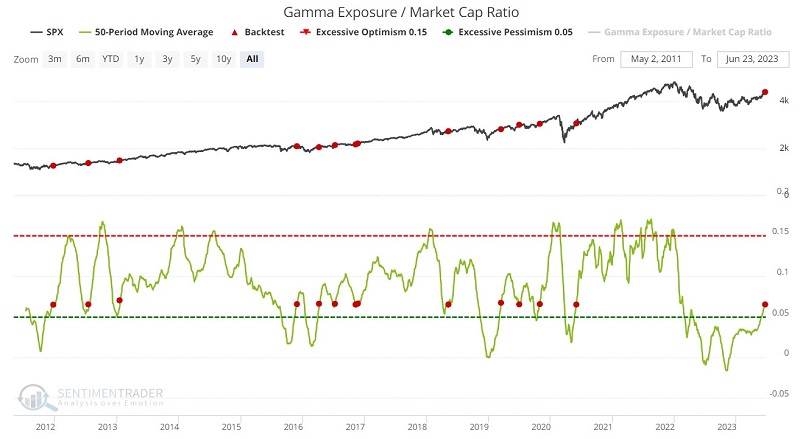
The 50-day average for our Gamma Exposure / Market Cap Ration indicator has continued to rise since the earlier signal. In so doing, it has crossed another significant threshold that has generated useful signals for both the S&P 500 and the Nasdaq 100.
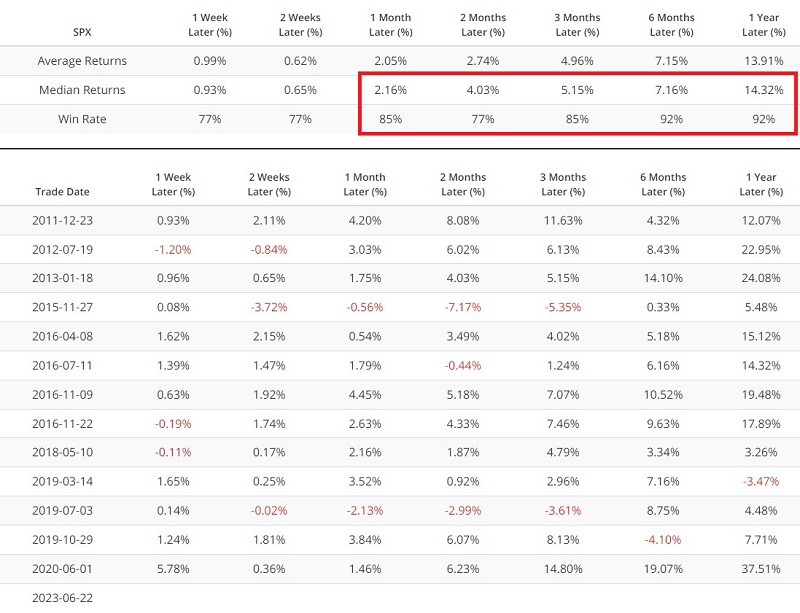
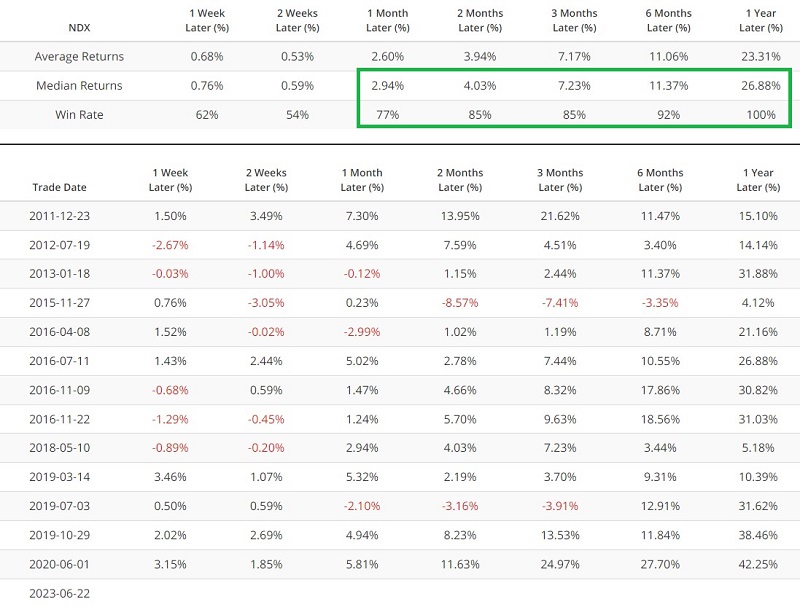
The red dots in the chart below highlight those dates when the 50-day average of the Gamma Exposure / Market Cap Ratio indicator crossed above 0.065. The table summarizes the subsequent S&P 500 Index performance. The most recent signal occurred on 2023-06-22.
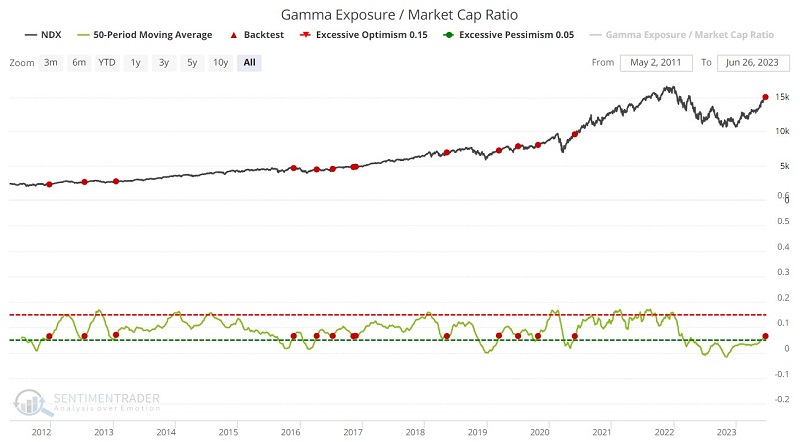
The chart and table below highlight performance for the Nasdaq 100 Index following signals from the above iteration of the Gamma Exposure / Market Cap Ratio indicator.
What the research tells us…
Following the recent rally in the S&P 500 Index and especially in the Nasdaq 100 since the October 2022 lows, a slowdown should not come as a surprise. Nevertheless, the weight of the evidence, such as the recent signals highlighted above, suggests that - while tempered expectations may be in order - investors continue to give the bullish case the benefit of the doubt.