
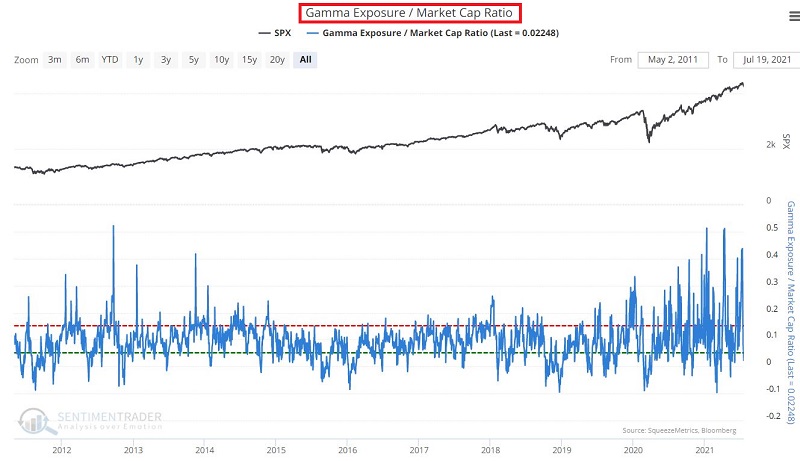
Gamma Exposure a Short-Term Negative for Stocks

The Gamma Exposure / Market Cap Ratio indicator has a history of signaling potential short-term weakness in the stock market. Gamma exposure refers to the sensitivity of existing options contracts to changes in the underlying price of the S&P 500. This indicator assesses the level of Gamma Exposure relative to the market capitalization of U.S. stocks. The higher the level, the more potential selling pressure.
THE TEST
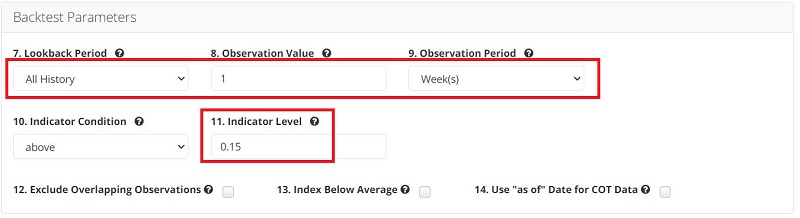
You can click here to run the Backtest Engine test that highlights any day when:
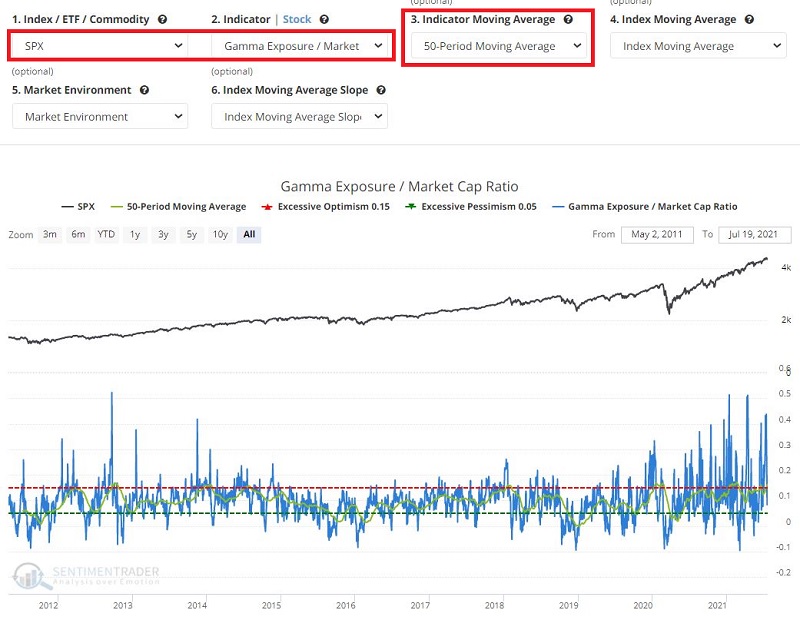
- The 50-day moving average of Gamma Exposure / Market Cap Ratio
- Is above 0.15
The input screens appear below.
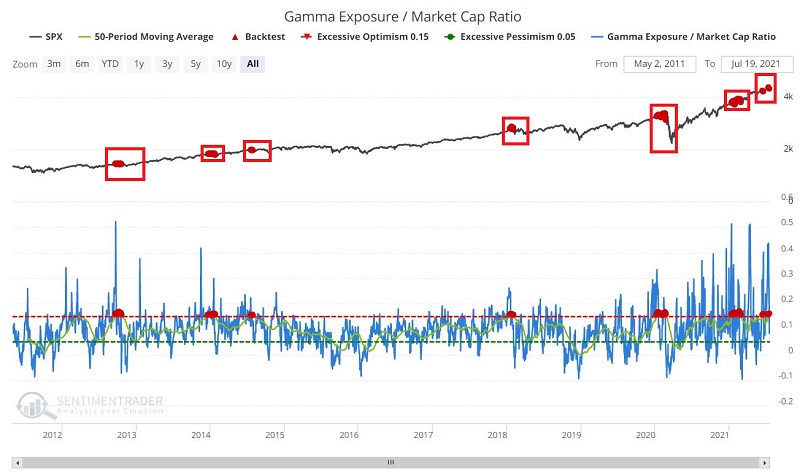
THE RESULTS
The output screen appears below.
The table below displays the summary of previous signals
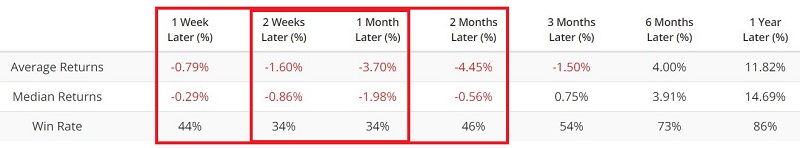
The key things to note for the 1-week to 2-months timeframes is that:
- The Average Returns and Median Returns are all negative
- The Win Rate is below 50% - with 2-Weeks and 1-Month Win rates at just 34%
THE IMPLICATION
While anything can happen in the stock market, this indicator suggests that it may take the stock market at least a little while to fully bounce back from the recent spate of weakness. At the very least, this argues for patience and some tempered expectations for traders and investors in the near term.