
Gaining an Edge With A Simple Two Factor Calendar/Trend Model

When you boil it all down, the two basic keys to long-term investment success are:
- Finding an edge
- Exploiting that edge as often as possible
Deciding what constitutes that edge and deciding how to exploit it once you've found it is are two comprehensive topics. But for our purposes in this piece, let's make it as ridiculously simple as possible and look at one calendar factor and one price trend factor. The bottom line:
- IF the current month is between November and May AND the S&P 500 Index is above its 200-day moving average, THEN you are probably not presently in a bear market.
- IF the current month is between June AND October AND the S&P 500 Index is below its 200-day moving average, THEN there is a much higher degree of danger in the market.
To test this theory, we will use a simple two-factor Calendar/Trend Model using the following rules:
- Calendar: If the current month is November through May, add +2 points to our Calendar/Trend Model
- Trend: If the S&P 500 is above its 200-day moving average, add +1 point to our Calendar/Trend Model
NOTE: For the second factor, I use a 1-day lag. So, for instance, if on Monday's close, the S&P 500 is above its own 200-day simple moving average, then the Model gets +1 point for Wednesday.
For any given trading day, the model can read +3, +2, +1, or 0.
+3 = Both Calendar AND Trend factors are bullish
+2 = Calendar is bullish, but Trend is not
+1 = Trend is bullish, but Calendar is not
0 = Neither factor is bullish
Does this simple two-factor model offer an edge? Let's look at the results, and you can decide for yourself.
Results
Our testing period starts at the close on 10/31/1949 and extends through the close on 4/19/2021.
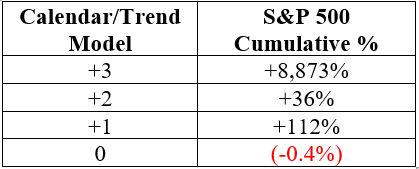
The table below displays the cumulative price gain achieved by the S&P 500 based on the daily reading for our Calendar/Trend Model.
The results in the table above are fairly compelling. The vast majority of market price gains occurred when BOTH Calendar and Trend factors were bullish, while the S&P achieved virtually no price gain when both factors were bearish.
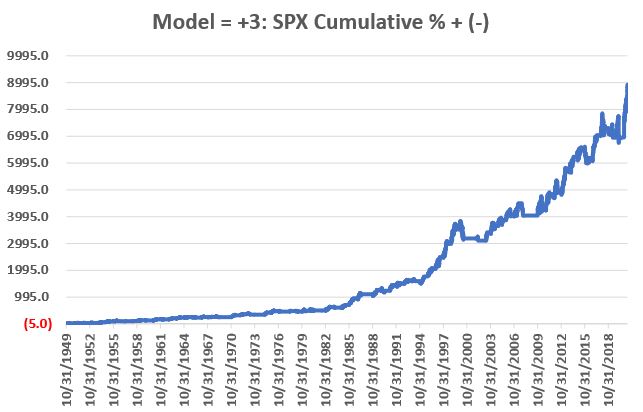
The chart below displays the cumulative % +(-) for SPX when the Calendar/Trend Model = +3. Note that while there are certainly declines along the way, there are no long, drawn-out bear markets.
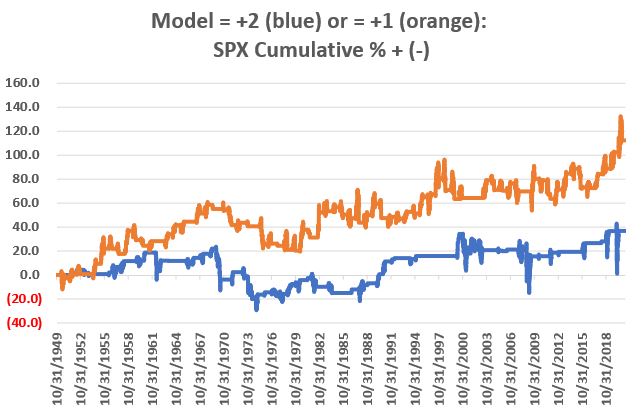
The chart below displays the cumulative % +(-) for SPX when the Calendar/Trend Model = +2 or +1. Note that while both show a net gain, the results are extremely volatile along the way, particularly compared to the chart above's performance.
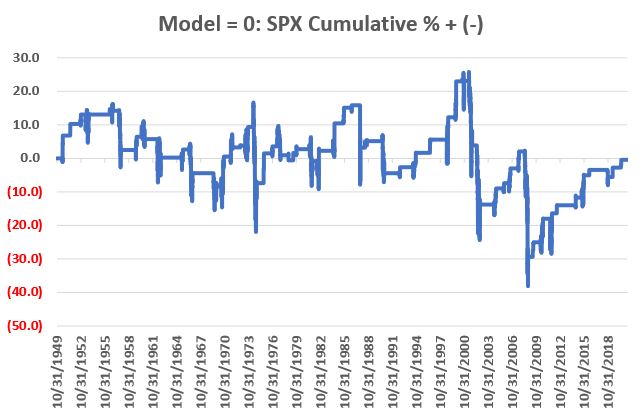
The chart below displays the cumulative % +(-) for SPX when the Calendar/Trend Model = 0. The good news is that there are plenty of up periods, and after the rally in the last decade, the net results are only slightly negative. The bad news is that virtually every major bear market played out primarily when this Model showed a reading of 0.
Ultimately:
- Cumulative SPX % price gain while reading = +3 = +8,873%
- Cumulative SPX % price gain while reading < +3 = +189%
The Real Key = Consistency
As a person who has analyzed a method or two, I can state that it is not uncommon to find methods that perform well over long periods of time. However, it is also not uncommon to find - under closer examination - that many of these methods perform well for a specific period of time and underperform for large swaths of time. The danger in this is that an investor is unlikely to continue to follow something that performs poorly over long periods of time.
The bottom line is that - in real-world trading - consistency is almost as important as raw profitability. So, let's consider the consistency of the Calendar/Trend Model.
The table below breaks down returns on a decade-by-decade basis.
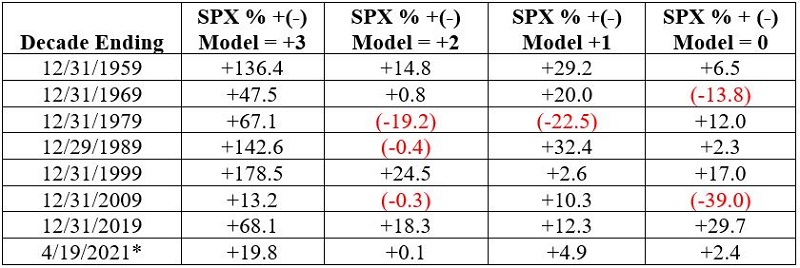
Note that for every completed decade - plus so far since 12/31/2019 - periods that register a +3 reading witnessed the most gains in the stock market.
Another important consideration in any trading is "how bad does it get?" The table below displays the worst drawdowns experienced if the S&P 500 Index were held only during periods meeting a given Model reading.
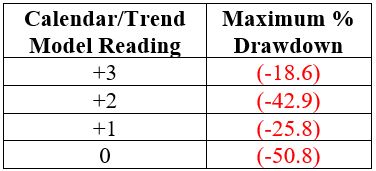
Market downdrafts can happen at any time (see Feb. and March of 2020). But during a reading of +3, the worst maximum drawdown was -18.6% - so not without risk, but a far cry better than a drawdown of -40% to -50% or more.
Regarding "Zero" Readings
One last point. It is not technically correct to label Calendar/Trend Model reading as "bearish." A better word might be "perilous." Take a close look at the chart below. It is the same return chart for 0 readings as shown above, but some trendlines have been added.
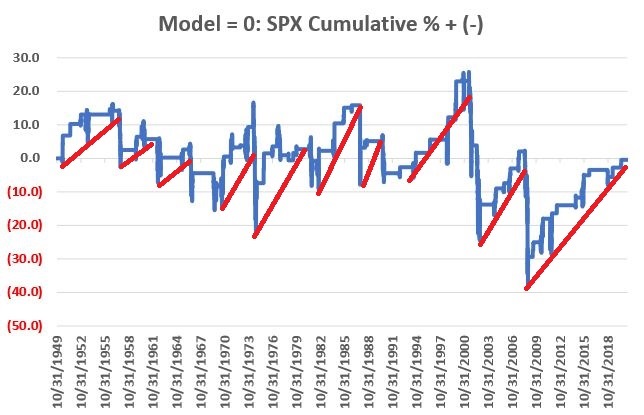
As you can see, it is not uncommon for the stock market to advance while the model reads "0". However, the key point is that when things go badly during a "0" reading, they tend to go very badly, and the market can lose a great deal of money in a short period of time. A closer look at the chart above reveals that things have been going pretty well during 0 readings in the last decade. The results in the chart suggest that this type of favorable activity is unlikely to last forever.
Summary
So here is the reality:
- A reading of +3 does NOT guarantee a bull market
- A reading of 0 does NOT guarantee a bear market
However, a reading of +3 argues in favor of giving the bullish case the benefit of the doubt. A reading of 0 has accompanied virtually every major bear market decline in the past 70+ years.
The good news for investors is that currently, the model is in +3 mode and will be until the end of May, and/or the S&P 500 somehow declines enough to fall below its 200-day average.