Data &
Technology
Research
Reports
Report Solutions
Reports Library
Actionable
Strategies
Free
Resources
Simple Backtest Calculator
Simple Seasonality Calculator
The Kelly Criterion Calculator
Sentiment Geo Map
Public Research Reports
Free Webinar
Pricing
Company
About
Meet Our Team
In the News
Testimonials
Client Success Stories
Contact
Log inLoginSign up
< BACK TO ALL REPORTS

Futures traders' odd position in Treasuries

Jason Goepfert
2020-10-06
In recent weeks, hedgers in 10-year Treasury futures have gone net short, while being long the 30-year contract. It has happened to this degree only twice before, both of which preceded a massively steeper yield curve, falling dollar, and rising gold.

In recent weeks, futures traders have been taking unusual positions in long-term Treasury contracts. As noted by Bloomberg, it looks like bets on the yield curve.

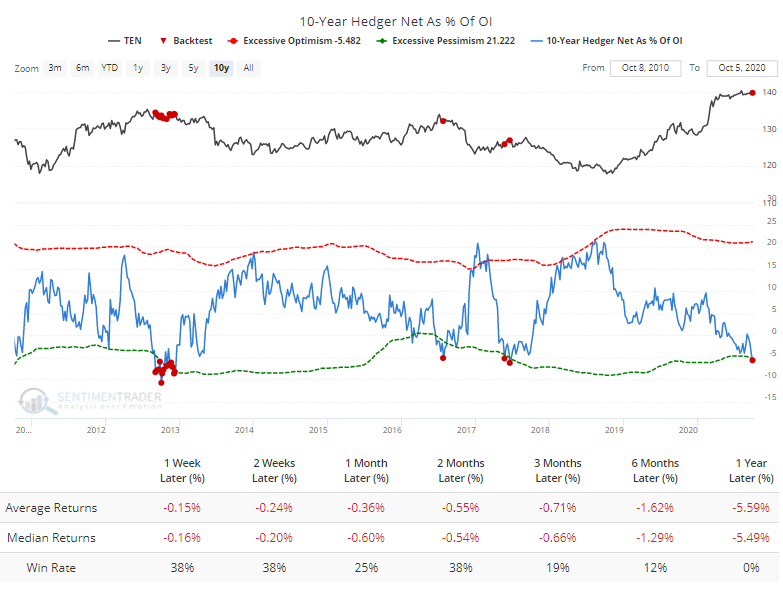
The differences in positioning are stark depending on whether we look at the 10-year note or 30-year bond. In the 10-year, "smart money" commercial hedgers are net short more than 5% of the open interest. Over the past decade, the Backtest Engine shows that the note declined after similar extremes.

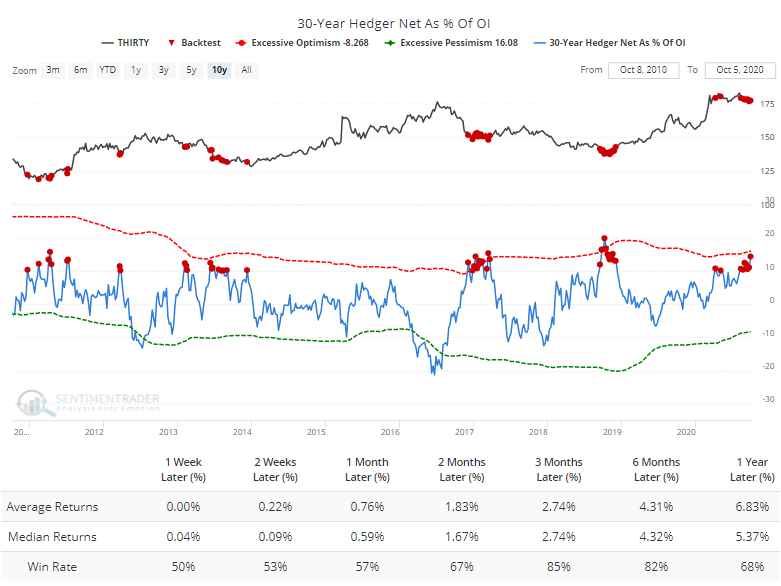
But in the 30-year contract, hedgers are heavily net long, which the Engine shows has led to mostly higher returns. This is exactly as it should be for a "smart money" indicator.

To see whether these bets have meant anything for the yield curve in the past, the chart below shows the difference in hedger positions in 30-year minus 10-year Treasury futures, expressed as a percentage of open interest. The higher the blue line, the more hedgers are betting on rising long-term bond prices and/or against intermediate-term note prices.

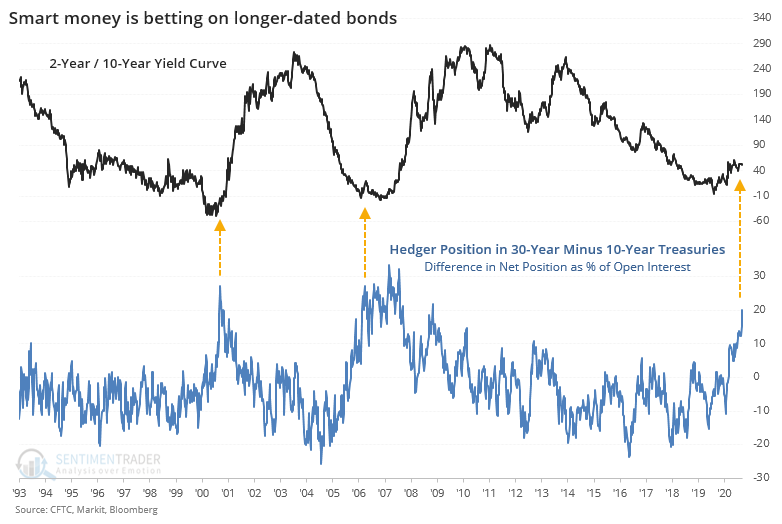
Looking at the typical 2-year / 10-year yield curve, this spread is rather astounding - it reached +20% right before the spread blew out and soared higher over the next 2-3 years. Both times, the spread went from being negative to the 10-year yielding at least 2.5% more than the 2-year.

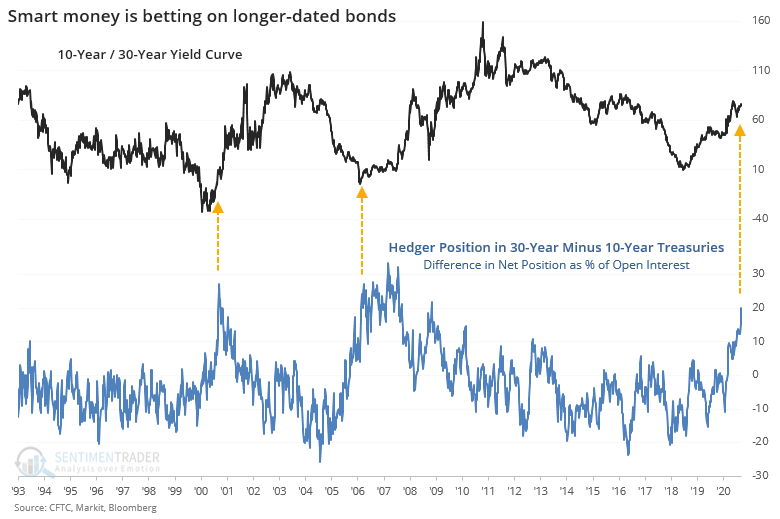
If we instead use the yield curve of the 10-year and 30-year contracts themselves, then it's a similar story. Both times, the yield on the 30-year jumped much more than that of the 10-year, which may not be what we would expect given how the contracts have behaved over the past decade following extremes in this data.

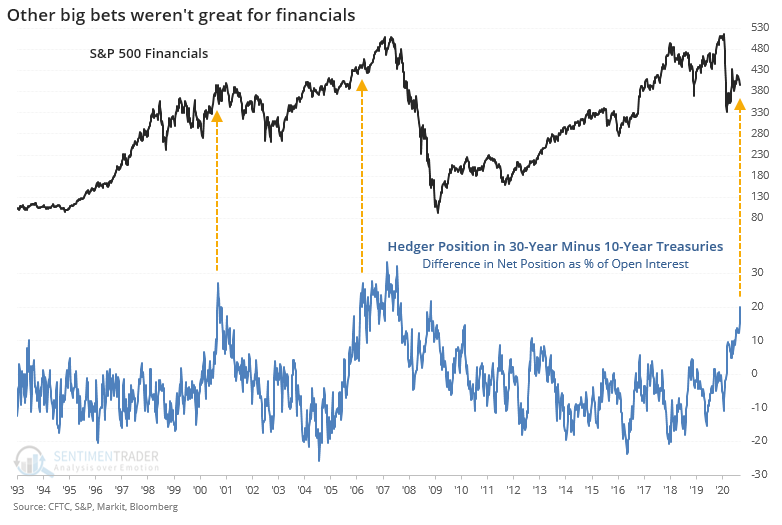
This is often used as a fundamental input for the financial sector. Using that as the comparison index does not look encouraging. While not necessarily top-ticking the bull markets, financials struggled mightily.

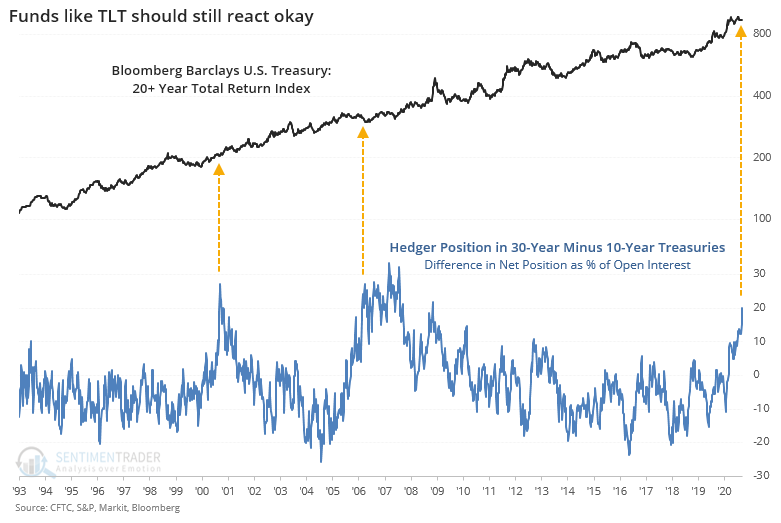
This difference in positioning causes a dilemma for the mom-and-pop trader, who uses funds like TLT as a proxy for "bonds" yet key off the 10-year yield as their guide to what the "bond market" is up to. The TLT fund has an effective maturity of about 25 years, so definitely skewed toward the longer end. When the spread in hedger positions reached this extreme the other two times, the total return of the underlying index fared very well, rising more than 44% within the next 3 years both times.

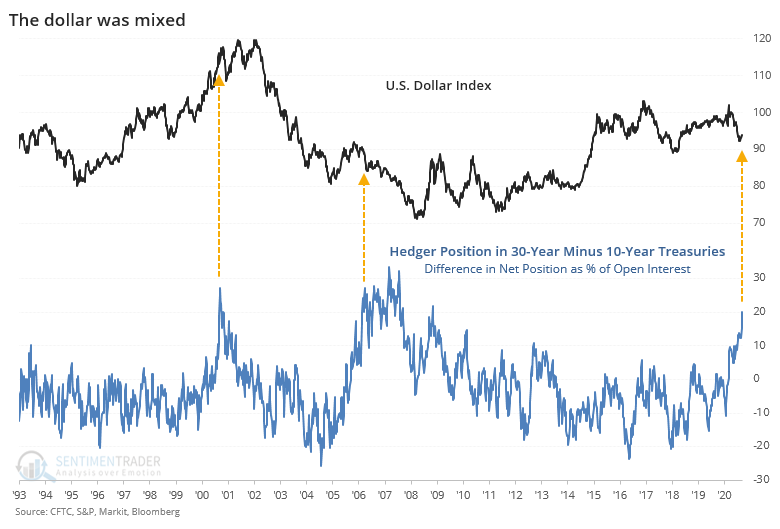
For the U.S. dollar, it preceded a couple of choppy years then a plunge the first time, and just a plunge the second time.

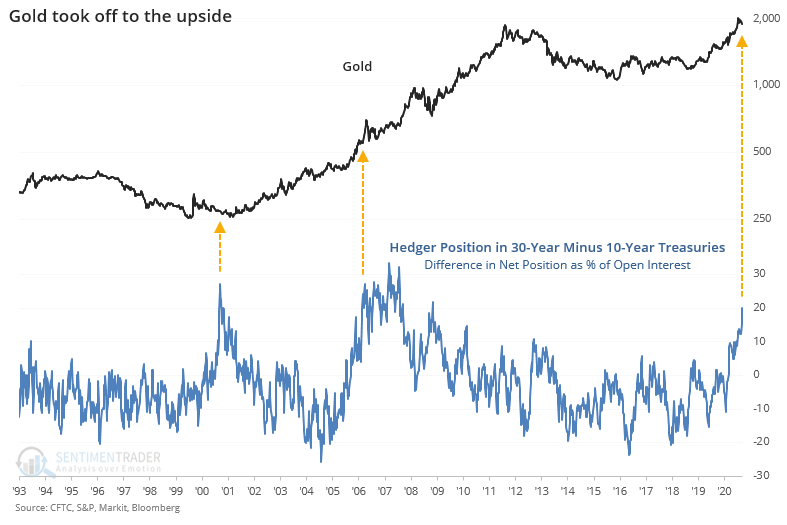
Both preceded massive gains for gold, rising more than 40% within the first 3 years of the September 2000 signal and 78% after the March 2006 one.

There are a whole lot of guesses about the upcoming presidential election, deficit spending, and economic recovery. While the sample size is painfully small, using the positioning of traders in 10- and 30-year Treasuries, it looks like a good bet is a steeper yield curve and rising gold.

Sorry, you don't have access to this report

Upgrade your subscription plan to get access
Go to Dasboard
DATA &
TECHnologies
IndicatorEdge
‍
BackTestEdge
‍
Other Tools
‍
DataEdge API
RESEARCH
reports
Research Solution
‍
Reports Library
‍
actionable
Strategies
Trading Strategies
‍
Smart Stock Scanner
‍
FREE
RESOUrCES
Simple Backtest
Calculator
Simple Seasonality
Calculator
The Kelly Criterion
Calculator
Sentiment Geo Map
‍
Public Research Reports
‍
Free Webinar
COMPANY
‍
About
‍
Meet our Team
‍
In the News
‍
Testimonials
‍
Client Success Stories
Pricing
Bundle pricing
‍
Announcements
‍
FAQ
© 2024 Sundial Capital Research Inc. All rights reserved.
Setsail Marketing
TermsPrivacyAffiliate Program
Risk Disclosure: Futures and forex trading contains substantial risk and is not for every investor. An investor could potentially lose all or more than the initial investment. Risk capital is money that can be lost without jeopardizing ones’ financial security or life style. Only risk capital should be used for trading and only those with sufficient risk capital should consider trading. Past performance is not necessarily indicative of future results.

Hypothetical Performance Disclosure: Hypothetical performance results have many inherent limitations, some of which are described below. No representation is being made that any account will or is likely to achieve profits or losses similar to those shown; in fact, there are frequently sharp differences between hypothetical performance results and the actual results subsequently achieved by any particular trading program. One of the limitations of hypothetical performance results is that they are generally prepared with the benefit of hindsight. In addition, hypothetical trading does not involve financial risk, and no hypothetical trading record can completely account for the impact of financial risk of actual trading. for example, the ability to withstand losses or to adhere to a particular trading program in spite of trading losses are material points which can also adversely affect actual trading results. There are numerous other factors related to the markets in general or to the implementation of any specific trading program which cannot be fully accounted for in the preparation of hypothetical performance results and all which can adversely affect trading results.

Testimonial Disclosure: Testimonials appearing on this website may not be representative of other clients or customers and is not a guarantee of future performance or success.