
From maximum Fear to extreme Greed

Key points:
- The Fear & Greed model has cycled from maximum fear to extreme greed
- During bear markets, this is the point when bulls run out of gas
- Extreme sector outflows might propel us further, which should help the "not a bear market rally" case
From maximum fear to a bit of greed
We've seen that Dumb Money Confidence has recovered. When it gets to this level of sentiment during bear markets, that's usually around where the rallies end, so it's a good attitudinal check.
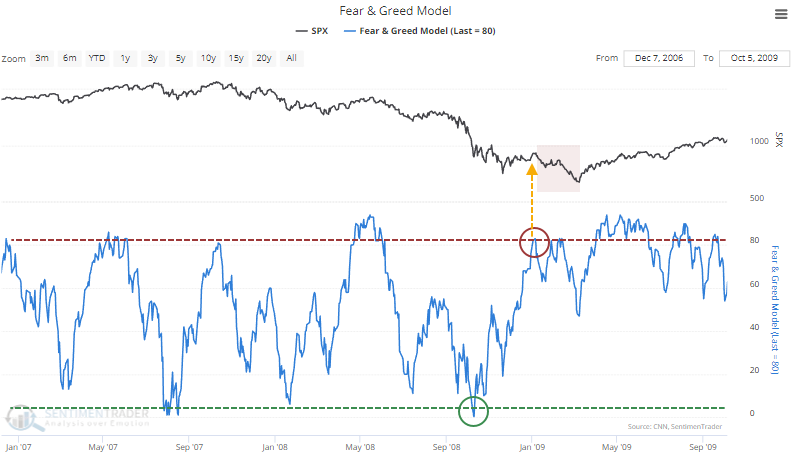
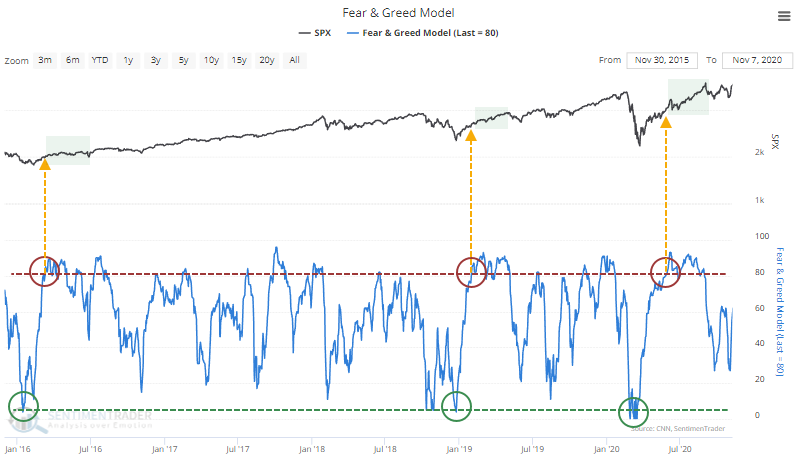
Another model, with different inputs, has also recovered but to an even larger degree. The Fear & Greed Model, based on the inputs published by CNN, has entered excessive optimism territory. Over the past 24 years, the S&P 500 has returned an annualized -0.3% when the model is above 80%.
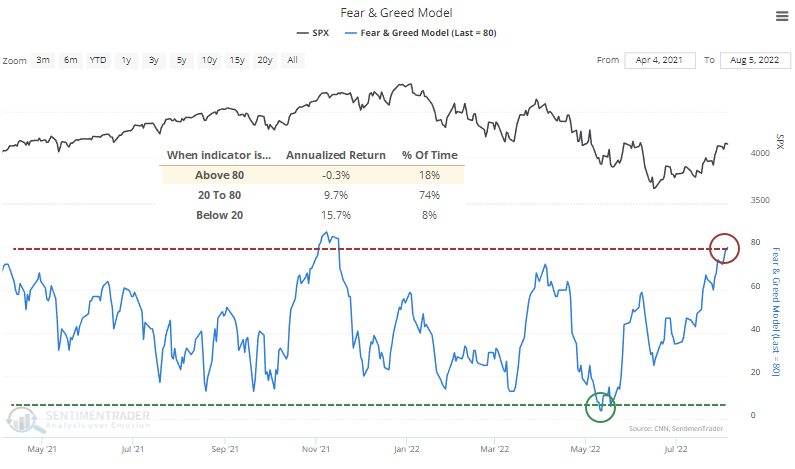
Note that our figures will differ from the one published on CNN. We use different inputs for the put/call ratio and, more importantly, junk bond spreads. But the general inputs and model calculations are essentially the same.
The current level of optimism comes after what was, for all intents and purposes, maximum pessimism in May when the model fell below 5%. It has cycled from near-maximum pessimism to optimism seven other times when the S&P 500 was below its 200-day average.
The S&P's future returns are interesting. During the failed bear market rallies, the index saw weakness almost immediately. During the bull markets ones, it didn't.
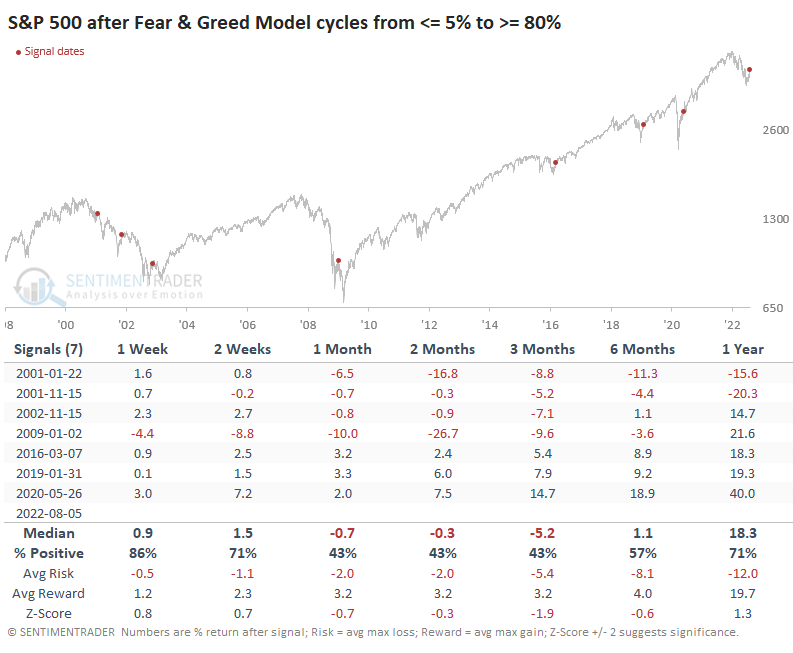
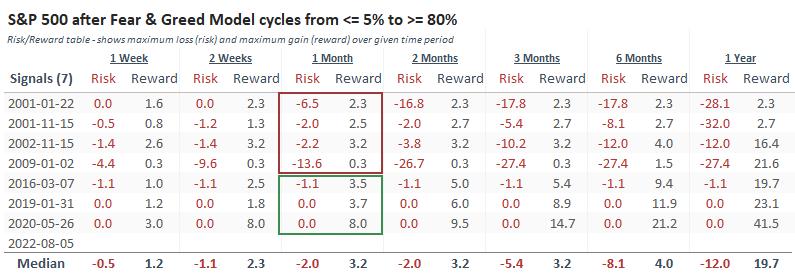
The Risk/Reward Table highlights this further. After all the failed signals, the S&P never gained more than 3.5% at any point in the month following the first 80% reading. After all the successful signals, it rallied at least 3.5% each time.
So, that's a good test here. If stocks can gain more than a few percent in the coming weeks, it will suggest a bull market.
When we zoom in on the 2001 instances, it's obvious how limited the reward for buyers was after the model reached its extreme.
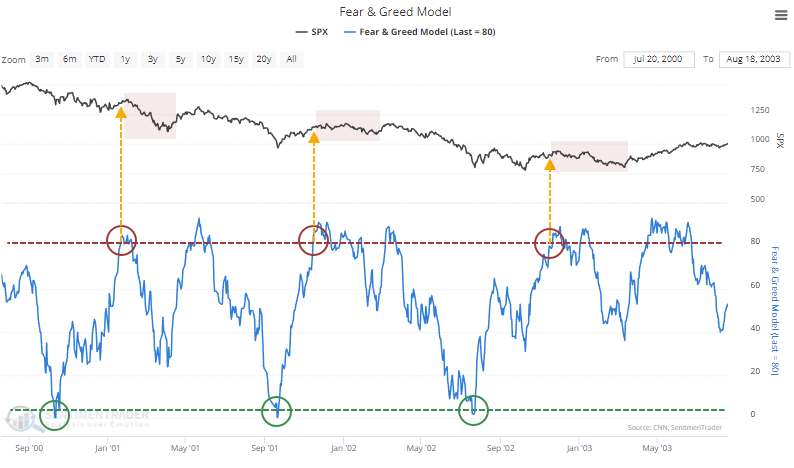
There were a couple of near misses for these sentiment cycles in 2007-08 when the model didn't drop or rise quite far enough, though the implication was the same - limited upside and a quick reversal into a downtrend.
Contrast that to the bull market signals. After these triggered, buyers' reactions were to just keep buying. There was minimal drawdown in the weeks after the model reached excessive optimism territory.
Still pulling money out of sectors
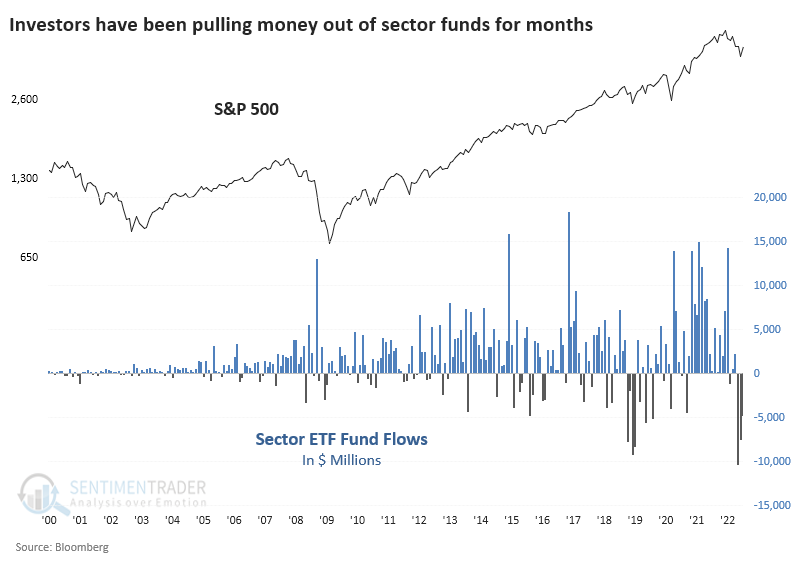
This isn't related to the model above; it directly conflicts with it. But when updating total sector ETF fund flows for July, it was striking that funds suffered a third consecutive monthly outflow.
The average monthly outflow for sector funds over the past three months was nearly $7.5 billion. That's the largest 3-month outflow in history.
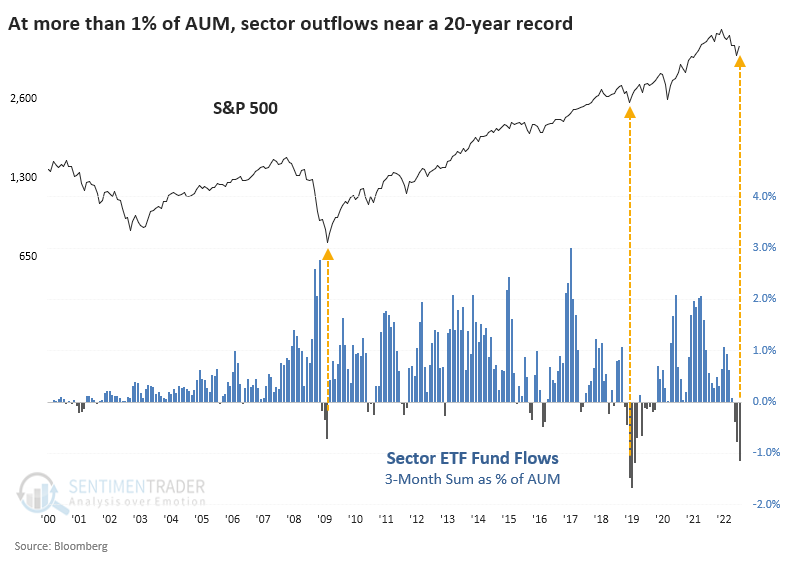
A fair point is that funds have grown assets over the years, so of course, they will suffer larger outflows. We're not at a record low when we express the 3-month total outflow for the amount of assets under management. But it's close.
The outflow totaled more than 1% of AUM, only the third time in 22 years that it exceeded 0.5%. The other two times were February 2009 and December 2018.
What the research tells us...
Signs of pessimism abounded in June, and some residual indicators like fund flows still show investors' repulsion toward stocks. Higher-frequency indicators have rebounded recently, pushing our sentiment models to the upper end of neutral or even into excessive optimism territory.
This is the point of sink-or-swim. Fly-or-die. Fish-or-cut-bait. All the idioms, including more colorful ones my grandpa would have used. During bear markets, this is the point where brave buyers take their gains, and shorts feel emboldened. During bull markets, this is when the latter gets steamrolled. Which one comes out on top over the next 3-4 weeks will tell us a whole lot about prospects through year-end and beyond.