Data &
Technology
Research
Reports
Report Solutions
Reports Library
Actionable
Strategies
Free
Resources
Simple Backtest Calculator
Simple Seasonality Calculator
The Kelly Criterion Calculator
Sentiment Geo Map
Public Research Reports
Free Webinar
Pricing
Company
About
Meet Our Team
In the News
Testimonials
Client Success Stories
Contact
Log inLoginSign up
< BACK TO ALL REPORTS

Friday Midday Color

Jason Goepfert
2019-04-05
null

Here's what's piquing my interest so far today.

Nice Run

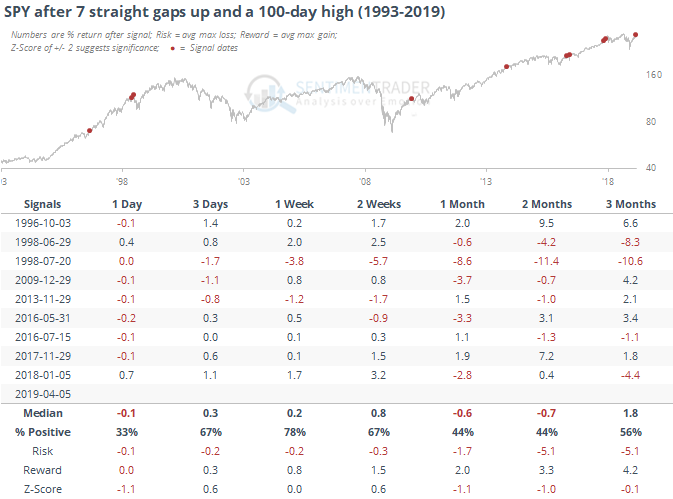
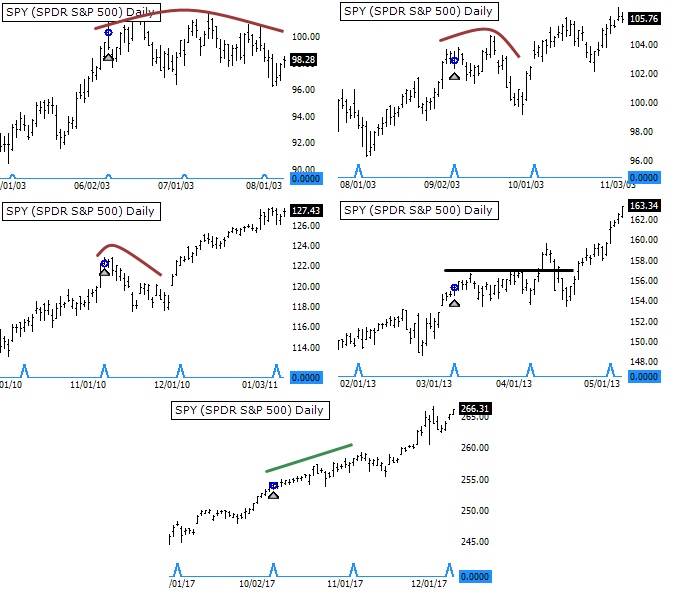
Bulls have been pushing things, with a long streak of up days and new 100-day highs. For the past 7 sessions, the S&P 500 fund, SPY, has gapped up at the open. We haven't seen that kind of pre-market enthusiasm since January 2018.

It's potentially notable that this is occurring in the aftermath of the Nonfarm Payroll report, typically the most important economic report in terms of market impact. There haven't been many times when SPY closed higher for at least 5 straight days ahead of the report.

It's also been relatively unusual to see SPY hit a 100-day high, then gap up the morning of the report.

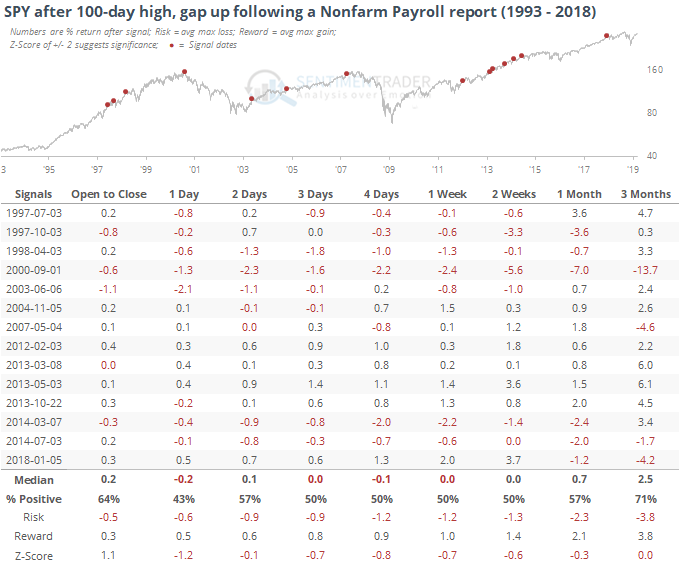
Returns weren't too bad, but that was due in large part to the mo-mo market of 2013. Taking out that one year, we get this:

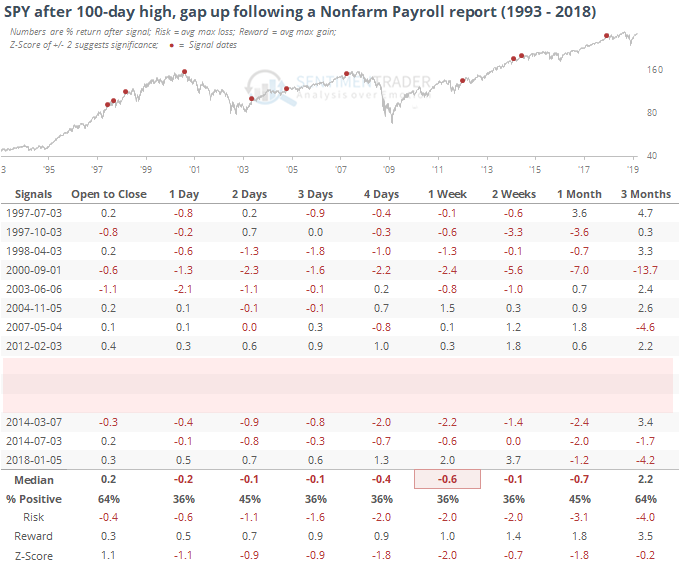
Here, the risk/reward was quite a bit less enthusiastic. All but one of the signals showed a negative return at some point between the next 3 days and 1 month.
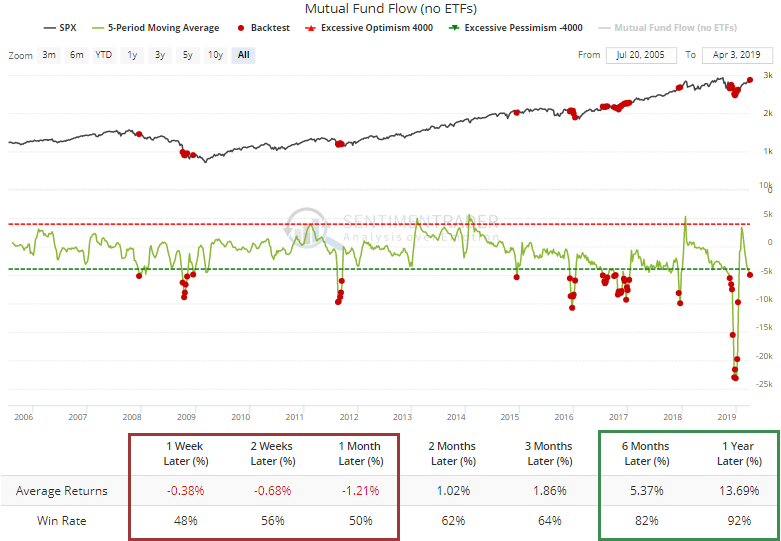
Flows

Over the past 5 weeks, investors have yanked an average of almost $5 billion / week from equity mutual funds. Even given the secular decline in mutual fund assets (for equities), this is getting extreme. Curiously, it hasn't been a great shorter-term sign, but longer-term returns were very good.
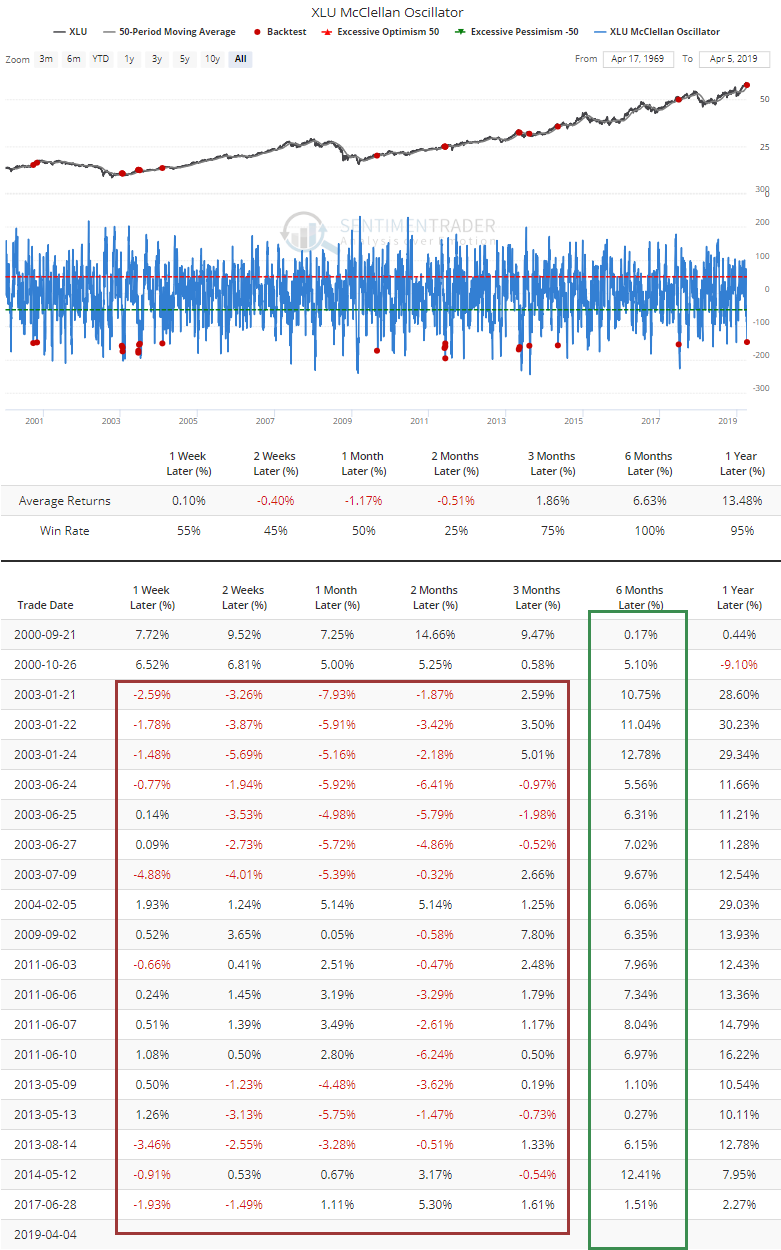
Utes

A couple of weeks ago, we saw that breadth in utilities was "too good." When a defensive sector like that sees the kinds of readings it did in late March, it almost always pulls back.

Now that momentum is seeping from the sector, the McClellan Oscillator for utilities is quickly cycling to the opposite extreme. There haven't been too many times when the Oscillator dropped below -145 when XLU was still trading above even its 50-day moving average. Almost every time, XLU continued to erode over the next 2-12 weeks, but every time it was trading higher 6 months later.

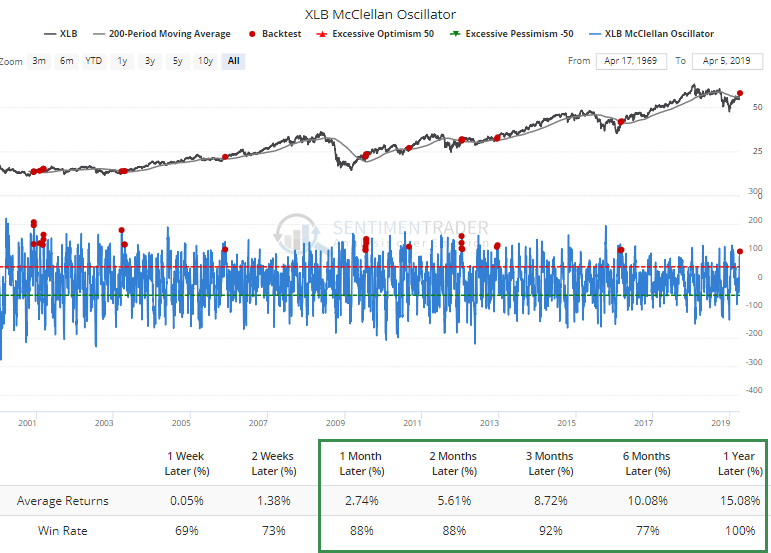
Material stocks have been among the best gainers lately, and the Oscillator for the sector has jumped above 100. When that triggers and XLB is trading above a downward-sloping 200-day average, it has led to consistently good returns. These indicate breath surges following a recovery from a downtrend.

Sorry, you don't have access to this report

Upgrade your subscription plan to get access
Go to Dasboard
DATA &
TECHnologies
IndicatorEdge
‍
BackTestEdge
‍
Other Tools
‍
DataEdge API
RESEARCH
reports
Research Solution
‍
Reports Library
‍
actionable
Strategies
Trading Strategies
‍
Smart Stock Scanner
‍
FREE
RESOUrCES
Simple Backtest
Calculator
Simple Seasonality
Calculator
The Kelly Criterion
Calculator
Sentiment Geo Map
‍
Public Research Reports
‍
Free Webinar
COMPANY
‍
About
‍
Meet our Team
‍
In the News
‍
Testimonials
‍
Client Success Stories
Pricing
Bundle pricing
‍
Announcements
‍
FAQ
© 2024 Sundial Capital Research Inc. All rights reserved.
Setsail Marketing
TermsPrivacyAffiliate Program
Risk Disclosure: Futures and forex trading contains substantial risk and is not for every investor. An investor could potentially lose all or more than the initial investment. Risk capital is money that can be lost without jeopardizing ones’ financial security or life style. Only risk capital should be used for trading and only those with sufficient risk capital should consider trading. Past performance is not necessarily indicative of future results.

Hypothetical Performance Disclosure: Hypothetical performance results have many inherent limitations, some of which are described below. No representation is being made that any account will or is likely to achieve profits or losses similar to those shown; in fact, there are frequently sharp differences between hypothetical performance results and the actual results subsequently achieved by any particular trading program. One of the limitations of hypothetical performance results is that they are generally prepared with the benefit of hindsight. In addition, hypothetical trading does not involve financial risk, and no hypothetical trading record can completely account for the impact of financial risk of actual trading. for example, the ability to withstand losses or to adhere to a particular trading program in spite of trading losses are material points which can also adversely affect actual trading results. There are numerous other factors related to the markets in general or to the implementation of any specific trading program which cannot be fully accounted for in the preparation of hypothetical performance results and all which can adversely affect trading results.

Testimonial Disclosure: Testimonials appearing on this website may not be representative of other clients or customers and is not a guarantee of future performance or success.