Friday Midday Color - Momentum Market, Energy Washout, Russell Breakout

Here's what's piquing my interest on yet another positive Friday. This marks the S&P's 14th rally out of 16 Fridays since the beginning of the year.
Momentum Market
Here's a question I got the other day, reflecting some version that's been asked several times essentially asking the same thing:
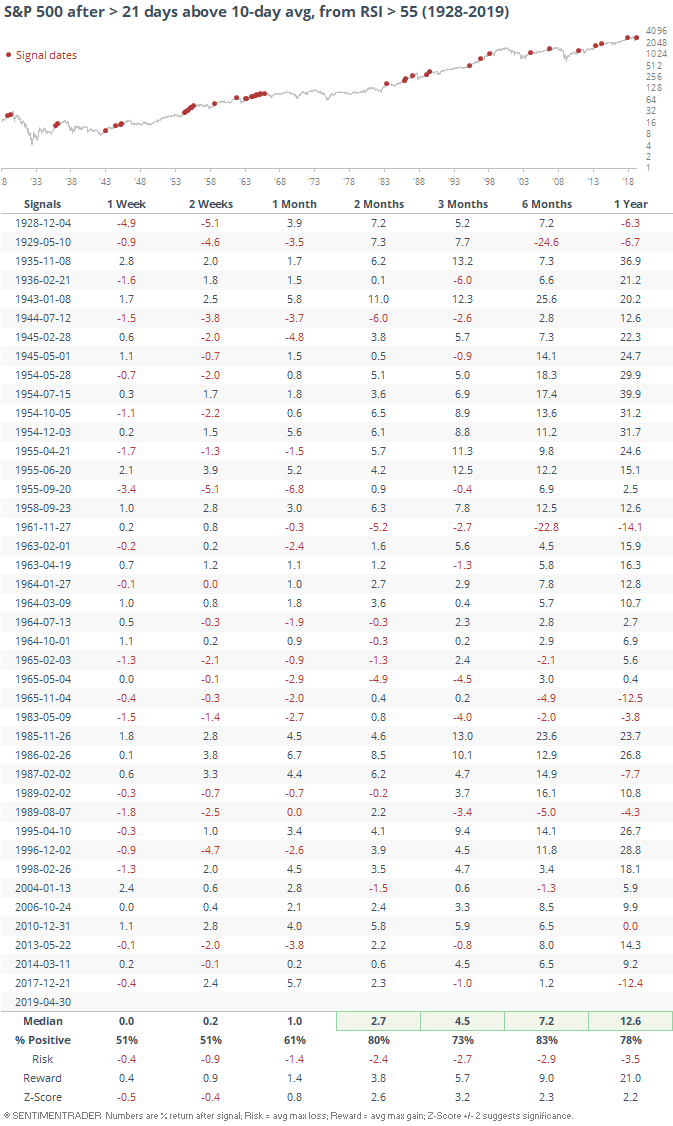
So during the month of April, the SPX (and NDX) never closed below the 10-day moving average. Have you ever run any scans on what performance tends to look like out the next month , especially when the rally occurs with weekly stochastics fully overbought at the beginning of the run ?? (alternatively, you could look at 20+day runs vs single months).
We've looked at versions of this over the years, but not considering a starting point when the S&P 500's weekly Relative Strength Index (RSI) at the start of the streak was already above neutral. Extreme momentum coming out of a low is consistently a good thing - maybe it's different coming out of neutral territory.
Not really.
Future returns were significantly positive, and that one-year risk/reward ratio was excellent.
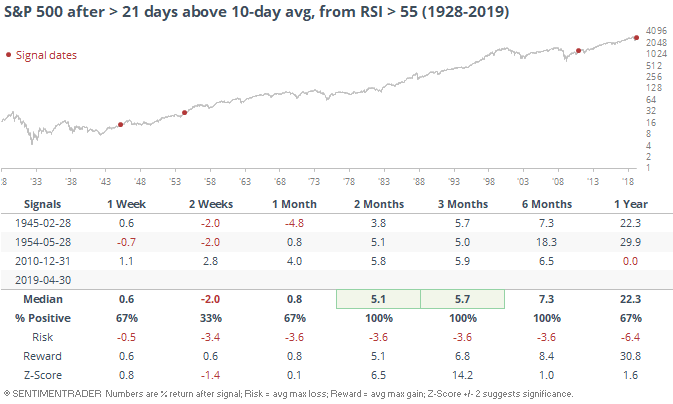
There were only three others that triggered at month-end, and all were at least 5% higher over the next 3 months. Momentum does not die easily.
Breadth Review
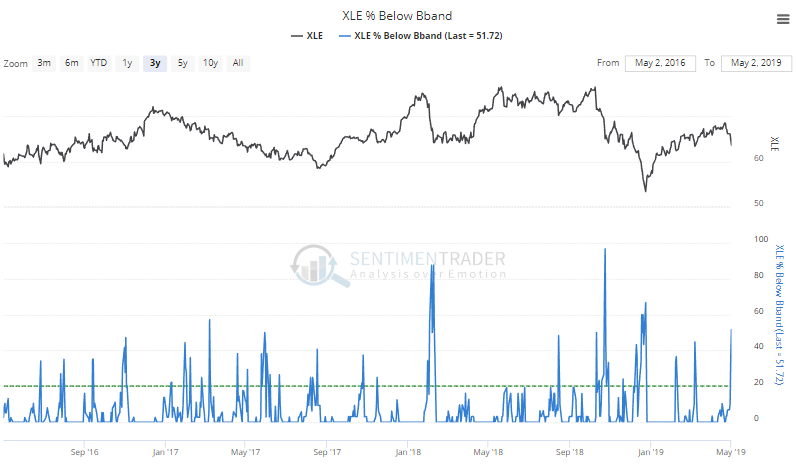
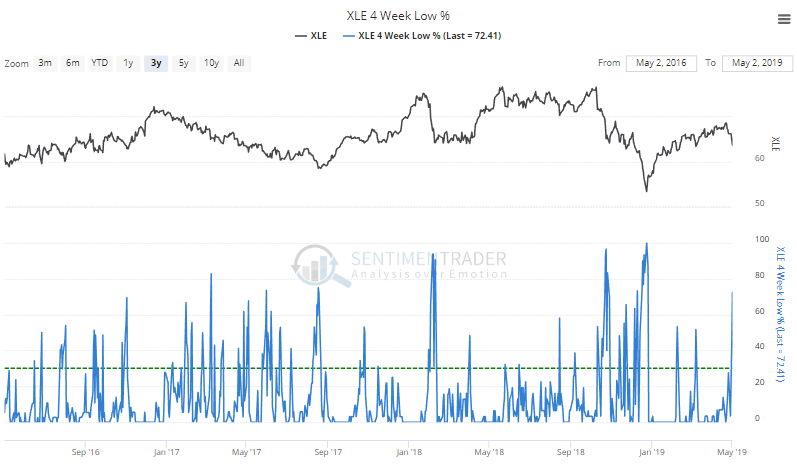
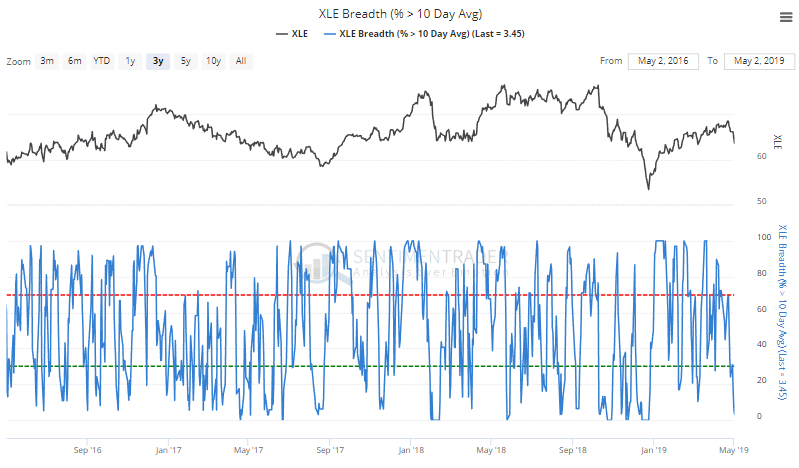
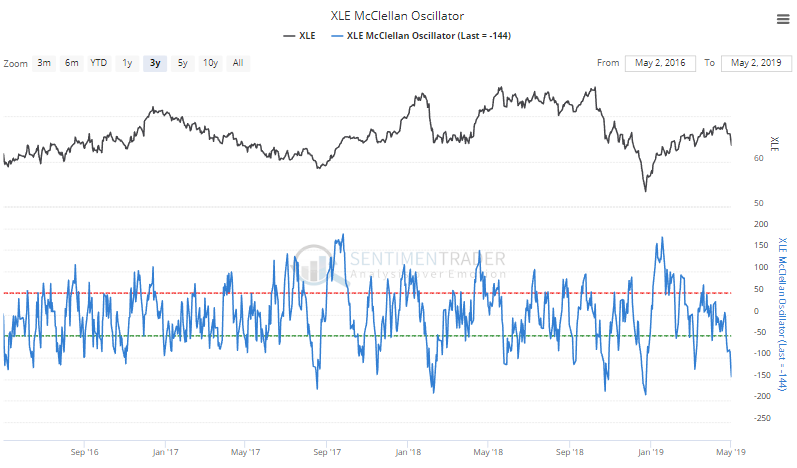
Energy stocks have been getting hit, and similar signs of waning momentum haven't been a particularly good sign. The selling has been enough, though, that some shorter-term extremes have popped up. Today's session looks to relieve some of that weakness.
More than 50% of stocks in the S&P 500 Energy sector are now below their lower Bollinger Bands.
That was enough to push more than 72% of them to one-month lows.
Fewer than 5% of the stocks are still holding above their short-term 10-day moving averages.
That has helped push the McClellan Oscillator well below -100.
Unlike some of the other times when these shorter-term breadth measures hit this kind of extreme, the sector is still more than 15% above its 52-week low. Looking at similar setups, we see future returns were mostly good, especially 3-6 months later.
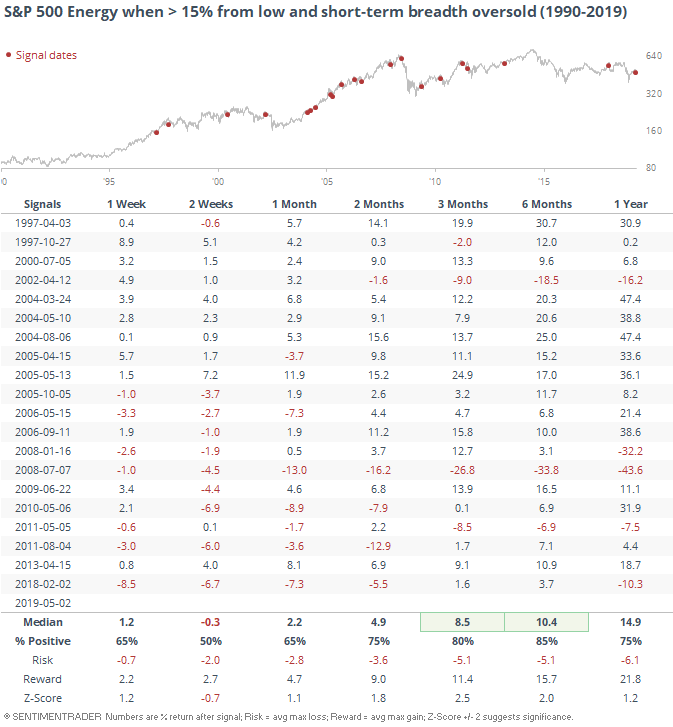
There were large losses in 2002 and 2008 as markets swooned into the final collapse of those bear markets. This doesn't seem like one of those times.
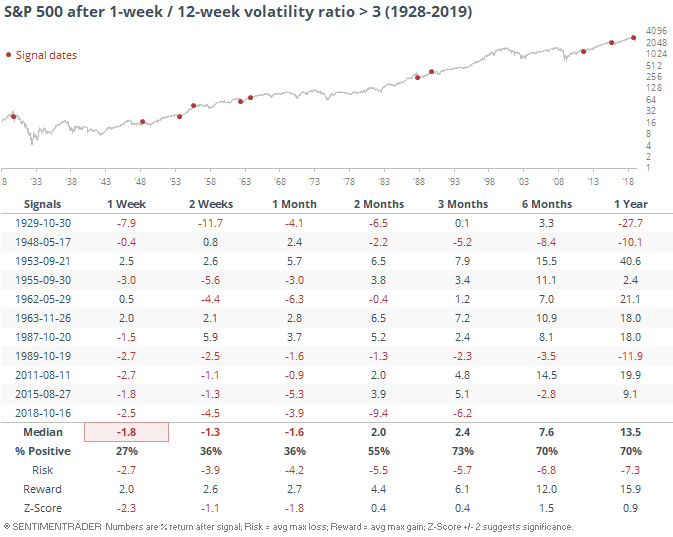
Volatility Explosions
Bloomberg notes that volatility surges have gotten more common over the past decade, likely due to the increasing influence of "robot" traders.
According to the article, the S&P 500 has experienced more spikes than ever before, using a ratio of the S&P's realized volatility over the past week to the past three months.
Maybe there are better ways to calculate it, but using the formula for historical volatility that we've always used, this is what we get since 1928.
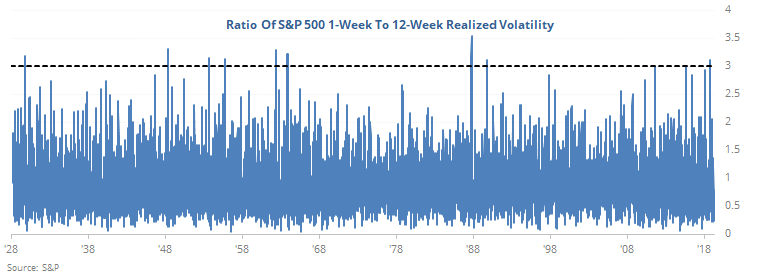
There hasn't been any pronounced increase in these spikes over the past decade. By this measure, it was more common to see "volatility events" in the 1950s-60s than now.
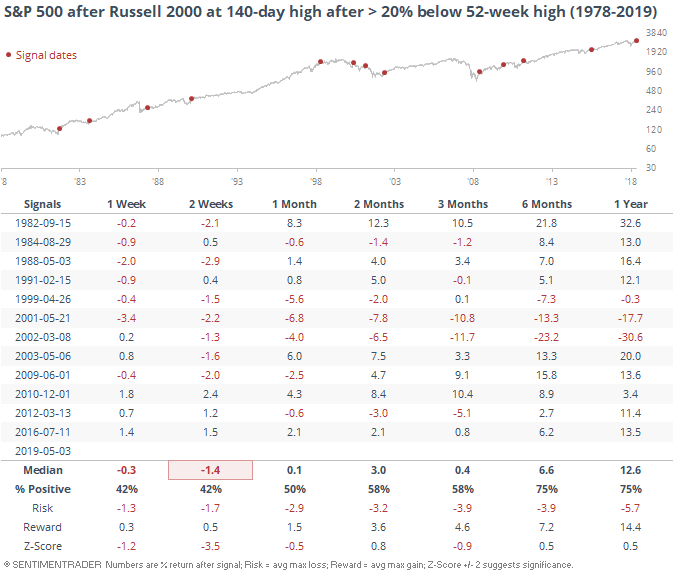
Recovering Russell
The small-cap Russell 2000 is doing well today, and hit its highest level since early October of last year. That's a nice rebound considering it was down more than 27% from its 52-week high since October.
Similar recoveries showed a mixed record going forward.
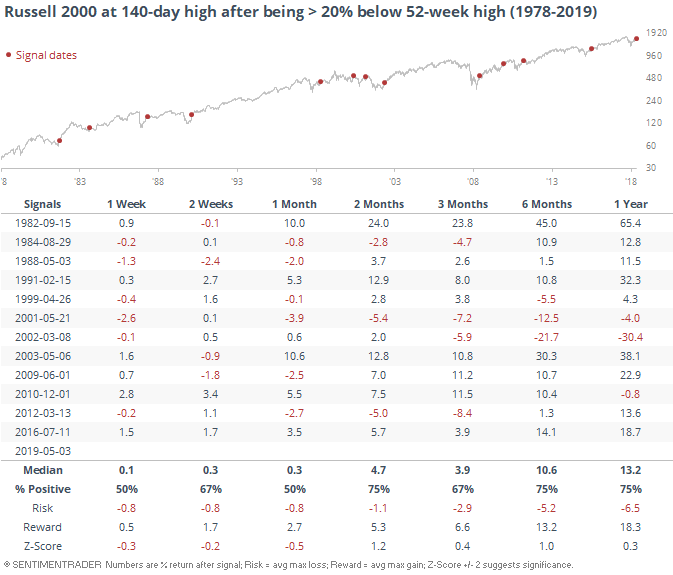
Curiously, it was a worse sign for larger-cap stocks. We've seen before that the Russell is not a particularly good leading indicator for the S&P 500.