Data &
Technology
Research
Reports
Report Solutions
Reports Library
Actionable
Strategies
Free
Resources
Simple Backtest Calculator
Simple Seasonality Calculator
The Kelly Criterion Calculator
Sentiment Geo Map
Public Research Reports
Free Webinar
Pricing
Company
About
Meet Our Team
In the News
Testimonials
Client Success Stories
Contact
Log inLoginSign up
< BACK TO ALL REPORTS

Friday Midday Color - Flows, Breadth Extremes, Shanghai

Jason Goepfert
2019-04-26
null

Here's what's piquing my interest so far on this Friday.

Argentinian Angst

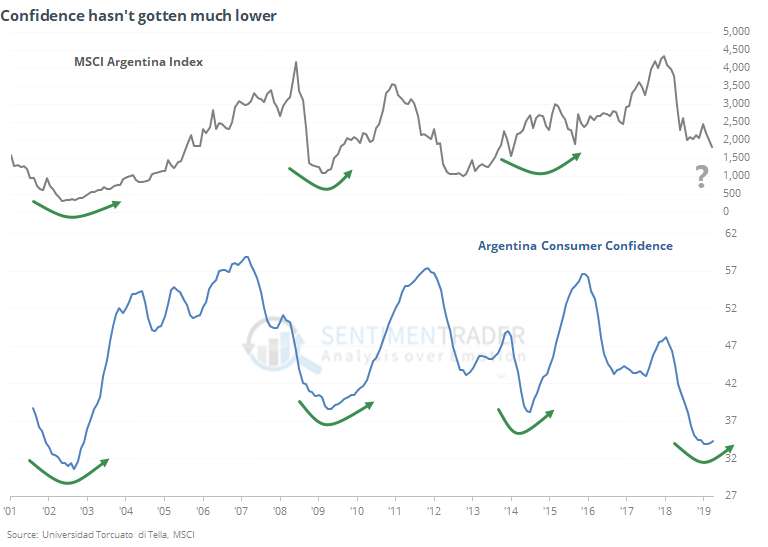
The WSJ notes that consumer confidence in Argentina has taken another hit due to political instability. I know next to nothing about the country, but it's at least worth noting that over the past 6 months, consumer confidence in that region has been as sour as it has been in the past 17 years, but the average is starting to potentially curl higher. Unlike some other countries, consumer confidence has a high correlation with the stock market.

Flow

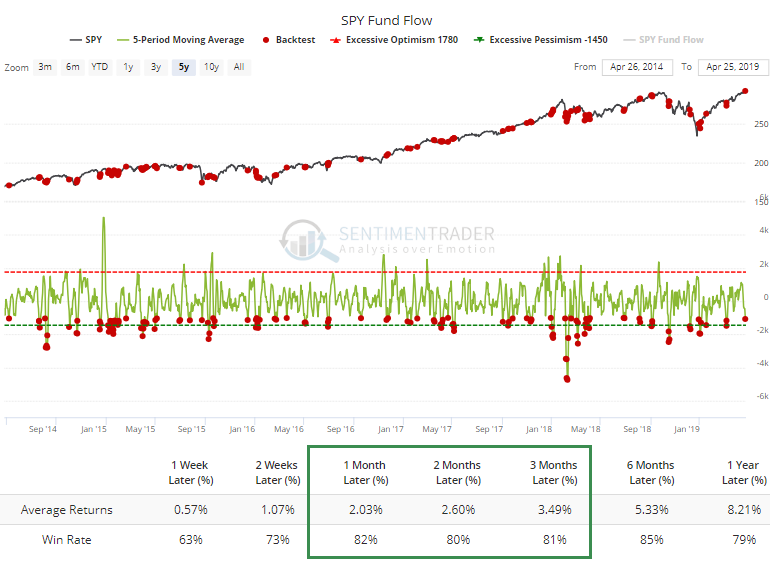
It's kind of curious to see investors leave SPY even as it rallies. The 5-day average shows an outflow of more than $1 billion per day. While fund flows are an iffy read on sentiment, similar outflows over the past five years have been a mostly positive sign for SPY.

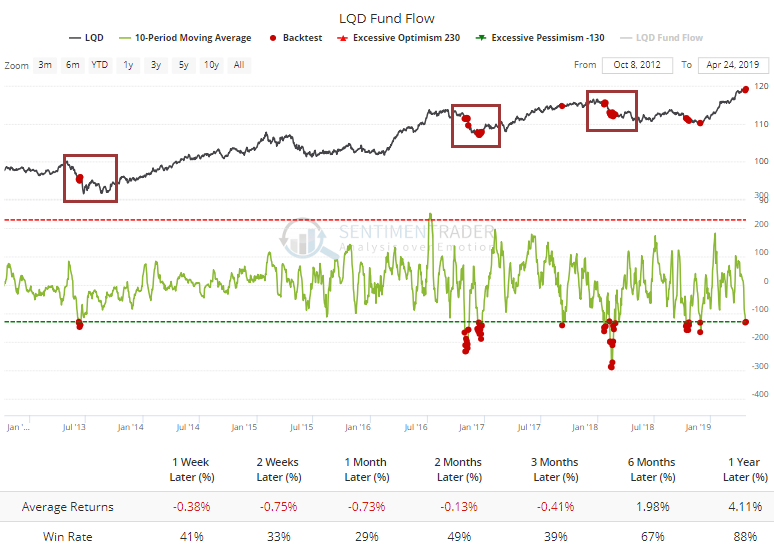
There have also been consistent outflows in some bond funds like LQD (investment-grade bonds). Over the past 10 days, the fund has suffered an average daily outflow of more than $125 million. Curiously, several peaks have seen a steady outflow - there is less of a contrary nature to these flows than there is with many other funds.

Breadth Review

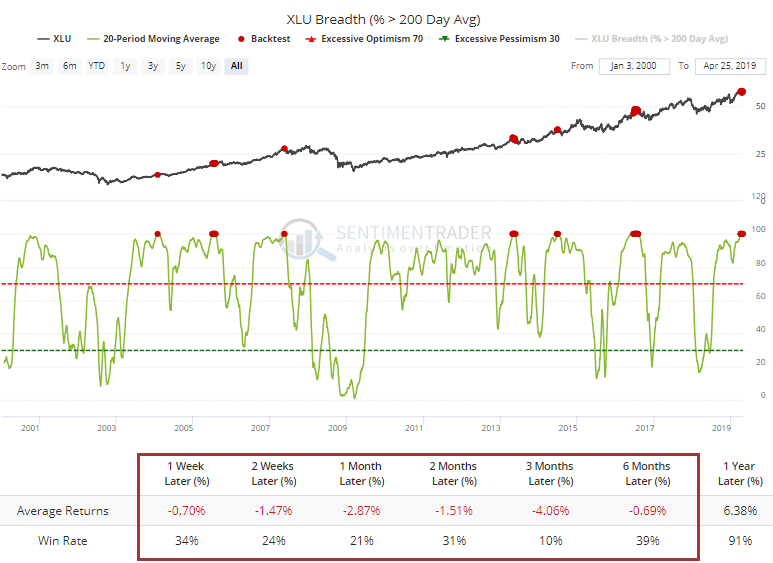
Every utility stock has been able to hold above its 200-day average for 20 days. The sector hasn't seen a sustained levitation like this very often. Almost every time, it ended up leading to a negative return in XLU over the next three months.

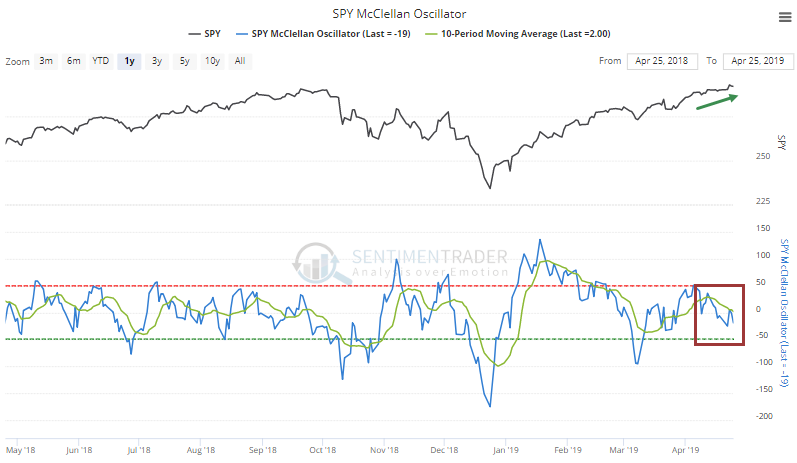
One thing I don't like is that while the S&P 500 has been moving higher, momentum has continued to be low and declining. The McClellan Oscillator for SPY has been hanging below zero, and below its 10-day average.

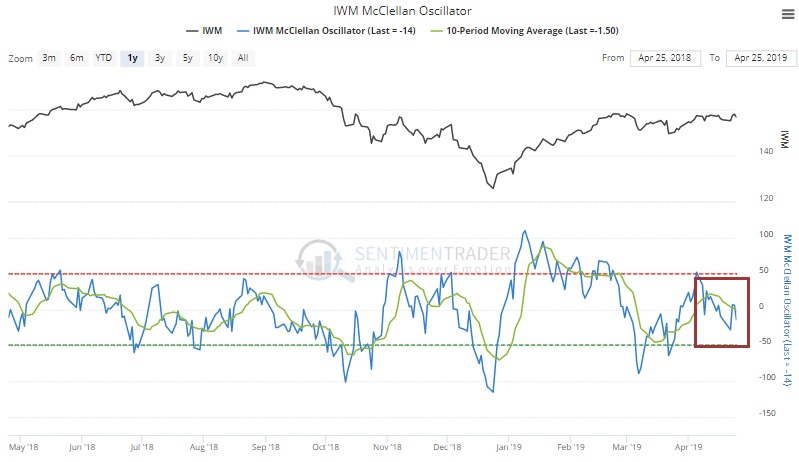
Same for small-caps, which isn't much of a surprise.

But it's also happening in the Nasdaq 100, which is (a surprise).

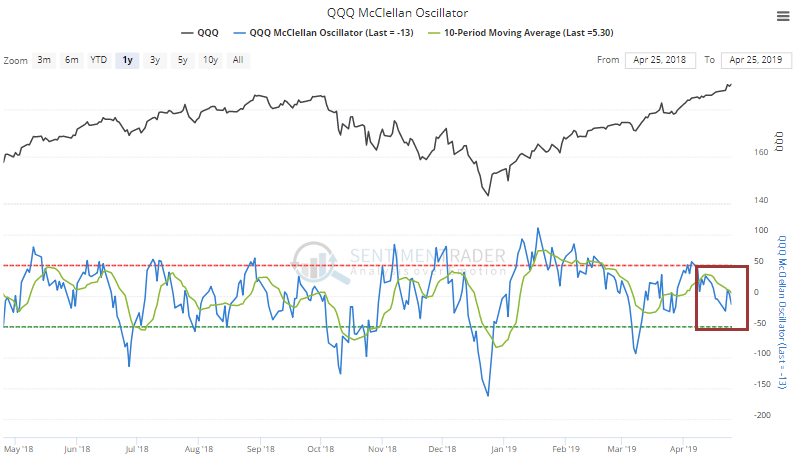
And also the broader tech market.

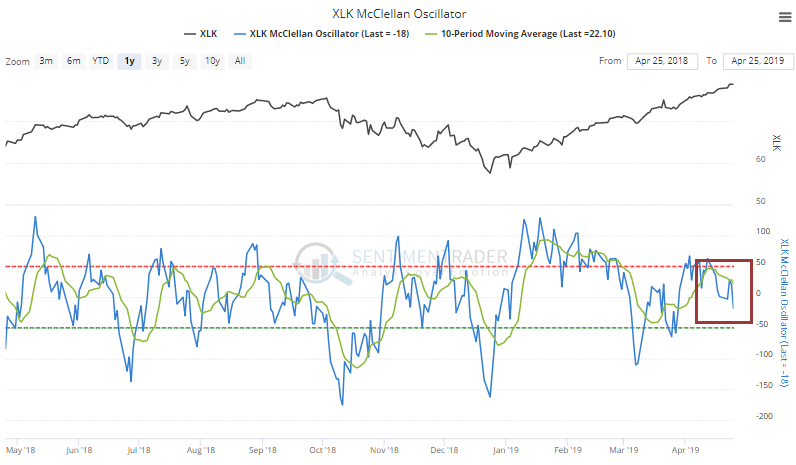
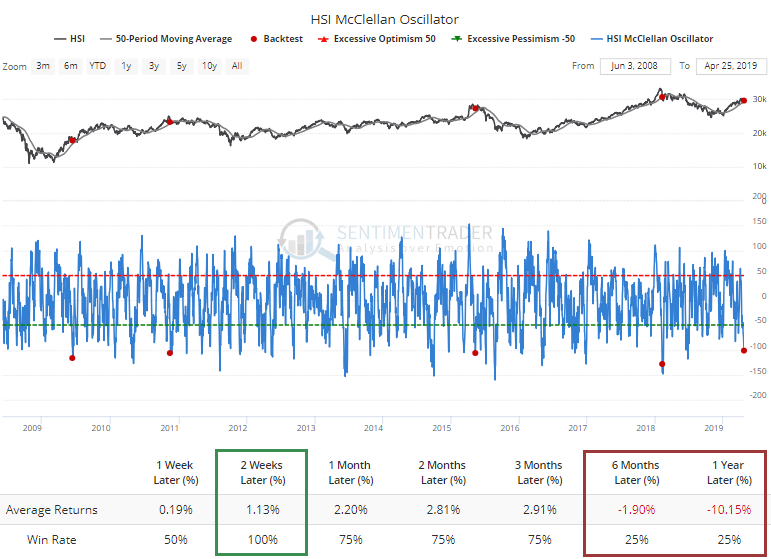
In overseas markets, there has been quite a bit of a thrust in selling pressure underlying some of the indexes like the Hang Seng, where the Oscillator has dropped below -100 while the index is still above its 50-day average. The few other times that happened, it rebounded in the short-term, but the impulse preceded a peak 3 out of 4 times.

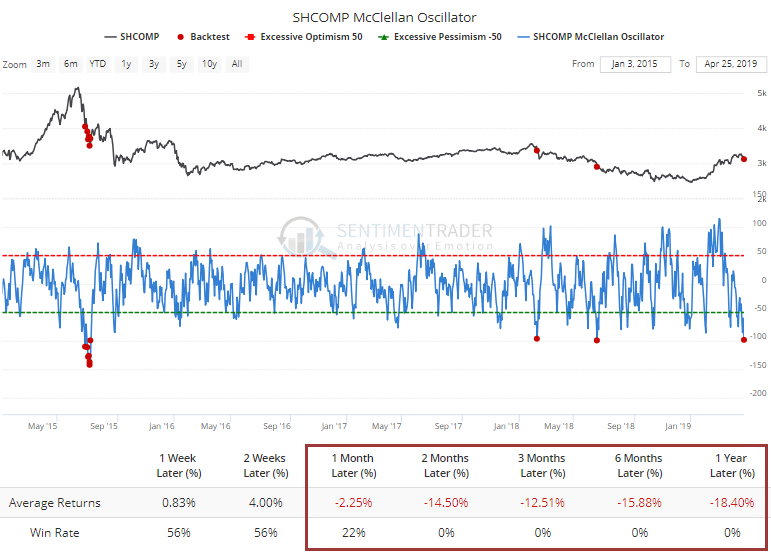
And while the huge thrust in the Shanghai had mostly positive longer-term implications when we looked at it a few weeks ago, it's a bit disturbing that underlying selling pressure has been enough to push that Oscillator below -100 as well. It's only been this low three other distinct times, and they marked selling impulses that didn't end immediately.

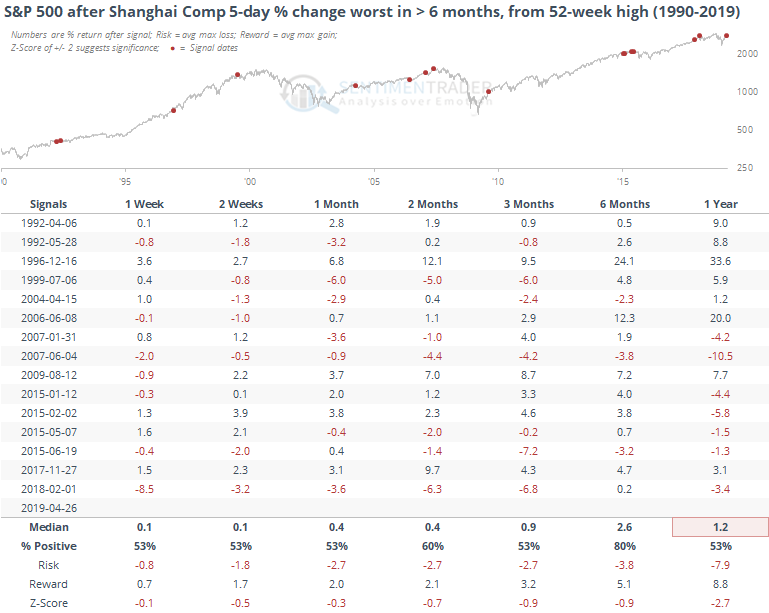
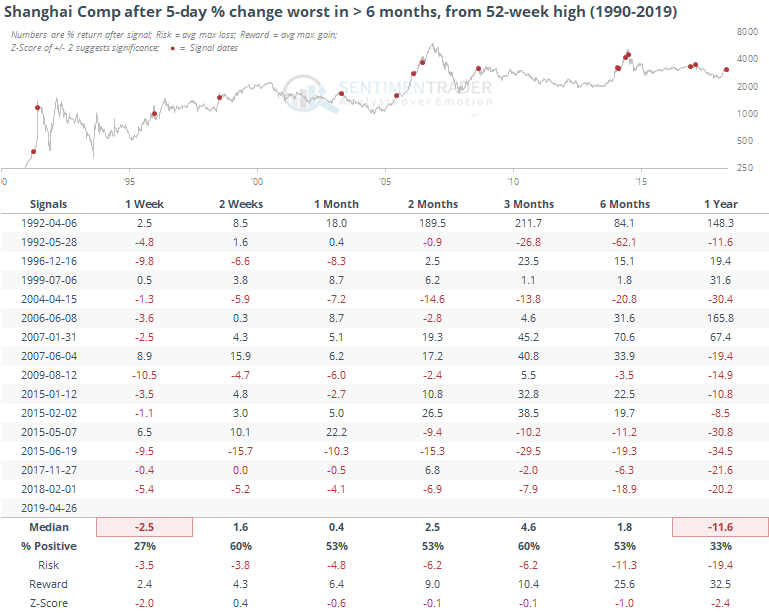
For the Shanghai, it had its worst 5-day return since last October.

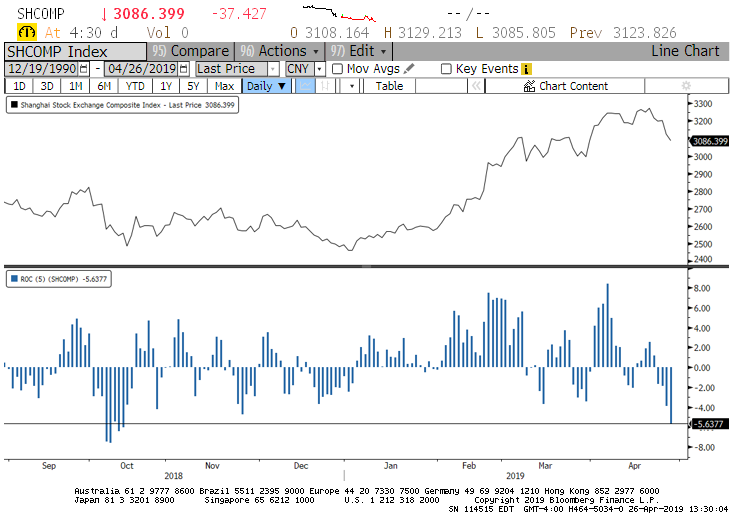
That hasn't been such a good sign for the Shanghai.

It also hasn't been a great sign for the S&P 500.

Sorry, you don't have access to this report

Upgrade your subscription plan to get access
Go to Dasboard
DATA &
TECHnologies
IndicatorEdge
‍
BackTestEdge
‍
Other Tools
‍
DataEdge API
RESEARCH
reports
Research Solution
‍
Reports Library
‍
actionable
Strategies
Trading Strategies
‍
Smart Stock Scanner
‍
FREE
RESOUrCES
Simple Backtest
Calculator
Simple Seasonality
Calculator
The Kelly Criterion
Calculator
Sentiment Geo Map
‍
Public Research Reports
‍
Free Webinar
COMPANY
‍
About
‍
Meet our Team
‍
In the News
‍
Testimonials
‍
Client Success Stories
Pricing
Bundle pricing
‍
Announcements
‍
FAQ
© 2024 Sundial Capital Research Inc. All rights reserved.
Setsail Marketing
TermsPrivacyAffiliate Program
Risk Disclosure: Futures and forex trading contains substantial risk and is not for every investor. An investor could potentially lose all or more than the initial investment. Risk capital is money that can be lost without jeopardizing ones’ financial security or life style. Only risk capital should be used for trading and only those with sufficient risk capital should consider trading. Past performance is not necessarily indicative of future results.

Hypothetical Performance Disclosure: Hypothetical performance results have many inherent limitations, some of which are described below. No representation is being made that any account will or is likely to achieve profits or losses similar to those shown; in fact, there are frequently sharp differences between hypothetical performance results and the actual results subsequently achieved by any particular trading program. One of the limitations of hypothetical performance results is that they are generally prepared with the benefit of hindsight. In addition, hypothetical trading does not involve financial risk, and no hypothetical trading record can completely account for the impact of financial risk of actual trading. for example, the ability to withstand losses or to adhere to a particular trading program in spite of trading losses are material points which can also adversely affect actual trading results. There are numerous other factors related to the markets in general or to the implementation of any specific trading program which cannot be fully accounted for in the preparation of hypothetical performance results and all which can adversely affect trading results.

Testimonial Disclosure: Testimonials appearing on this website may not be representative of other clients or customers and is not a guarantee of future performance or success.