Friday Midday Color - Pre-Market Fear, Failures, Overseas Extremes, Momentum Drops

Here's what's piquing my interest so far on this edgy Friday.
Pre-Market Fear
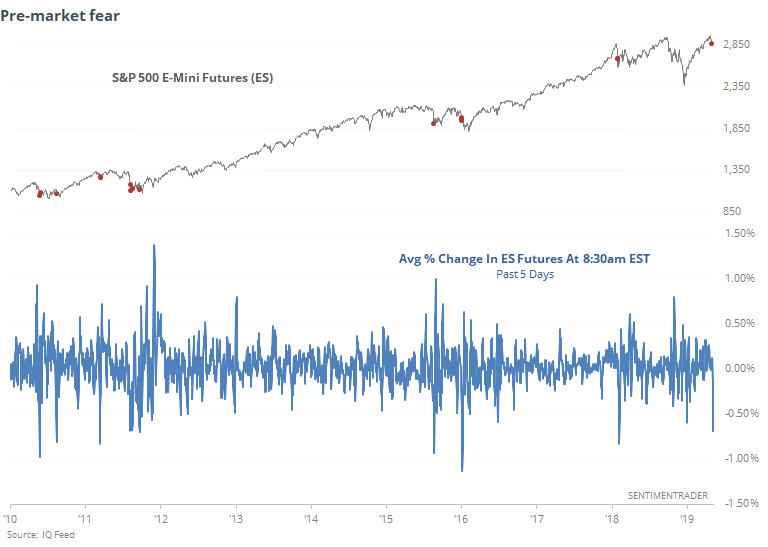
The uncertainty surrounding the trade posturing has triggered quite a bit of nervousness ahead of regular trading hours. By 8:30am EST, futures have shown relatively large losses each of the past six days. During the past week, S&P 500 e-mini futures have been down by an average of nearly 0.7%, about double what they were up each morning a little over a month ago.
We can see from the chart above (red dots) that when pre-market losses exceeded 0.5% on an average day during the past week, it equated with anxious markets, and usually near the end of the selling pressure.
Failed Breakout
One of the concerns now is that stocks have quickly cycled from a multi-year high not even two weeks ago to a 30-day low so far today. It's especially concerning given the time of year (sell in May and all that).
Below, we can see every time since 1928 when the S&P suffered a similar reversal in the spring, including any signal during April, May, or June.
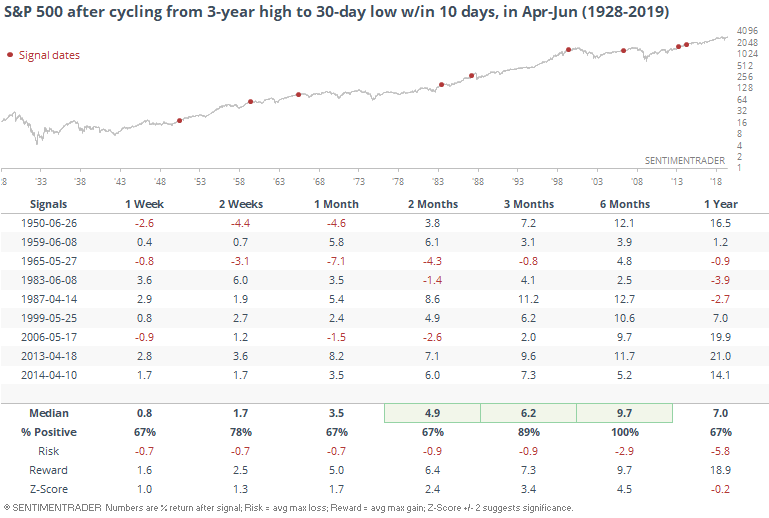
It wasn't a very good cause for concern. Six months later the S&P was higher every time, with an average return that was more than 4 standard deviations above random.
Breadth Review
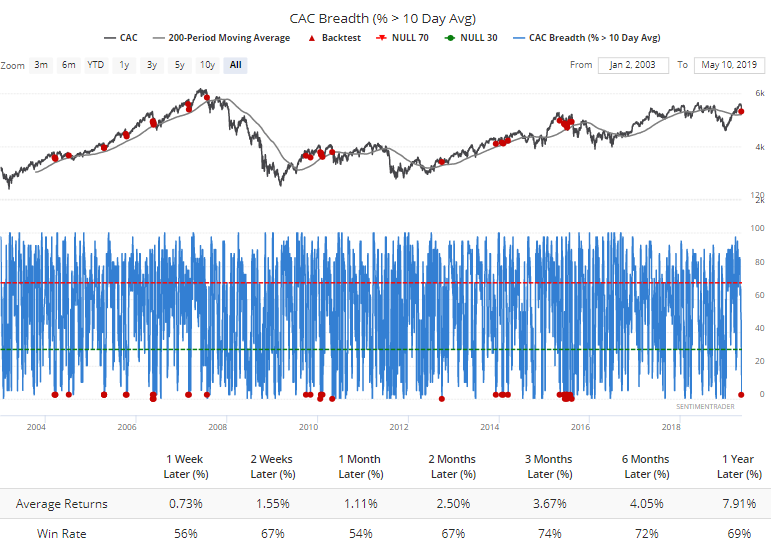
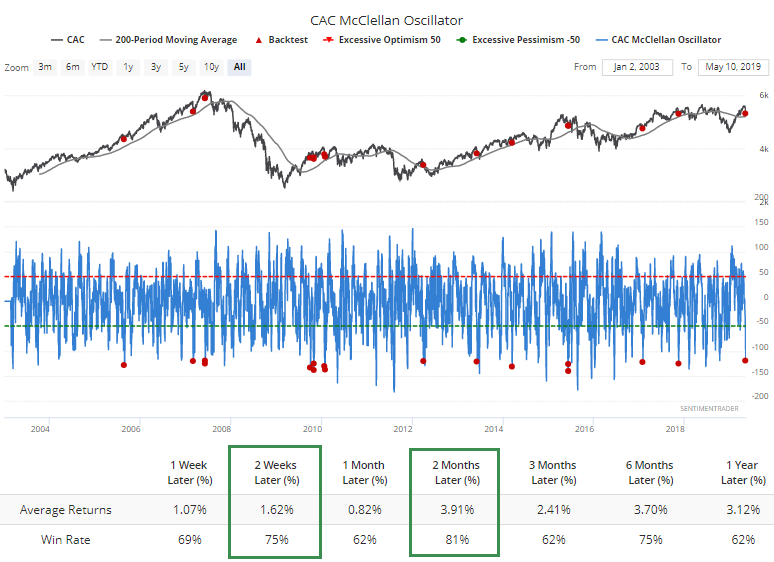
Most of the extremes triggering are occurring in overseas markets. On Thursday, they were acute in French stocks. In the CAC 40 index, there has been an extreme drop in stocks performing well shorter-term, despite the index remaining above its 200-day average.
Only 3% of the stocks have held above their 10-day moving average.
The pressure was enough to push the McClellan Oscillator to nearly -120.
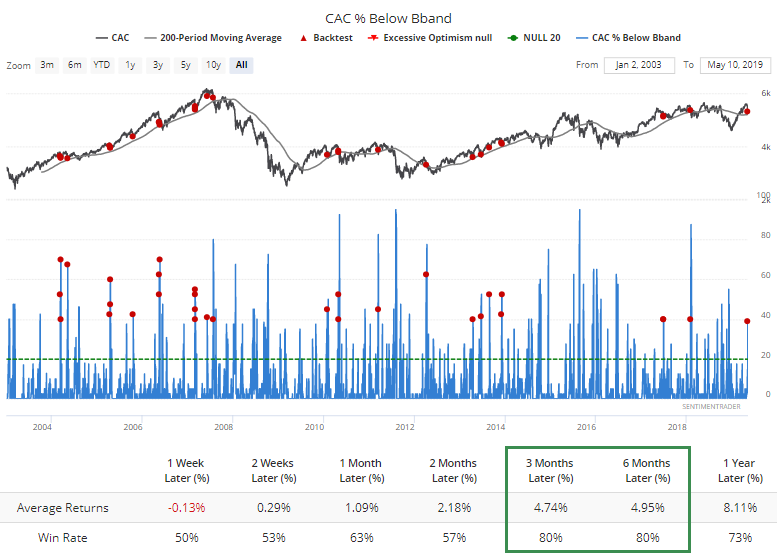
Almost 40% of them fell below their lower volatility bands.
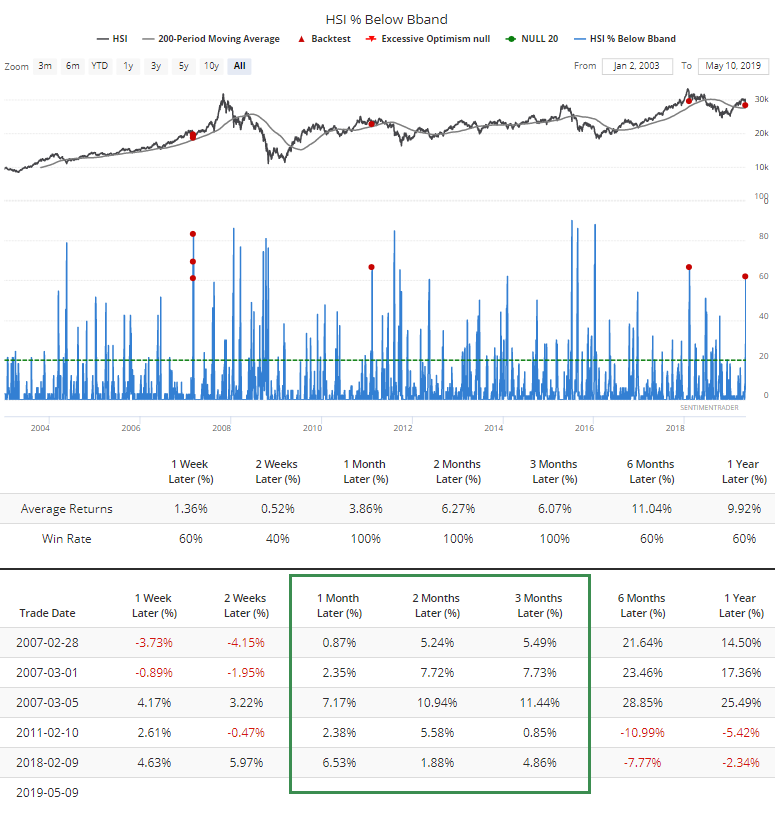
In the Hang Seng, that figure jumped above 60%, one of the highest readings in 16 years, especially when the index was still in a long-term uptrend.
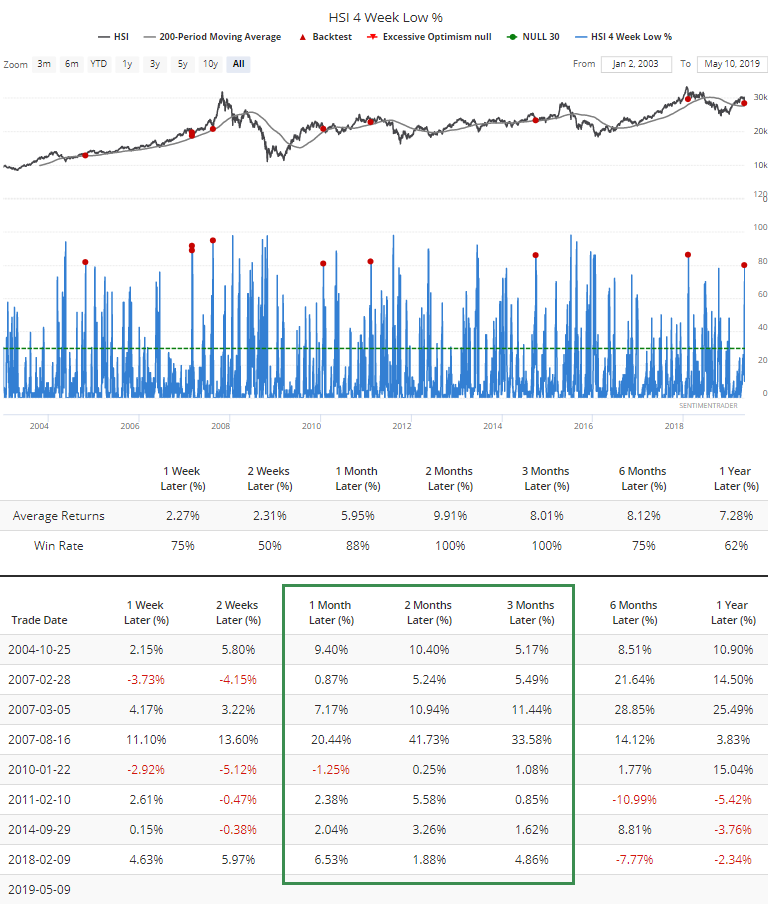
And 80% of those stocks have slid to their lowest levels in at least a month.
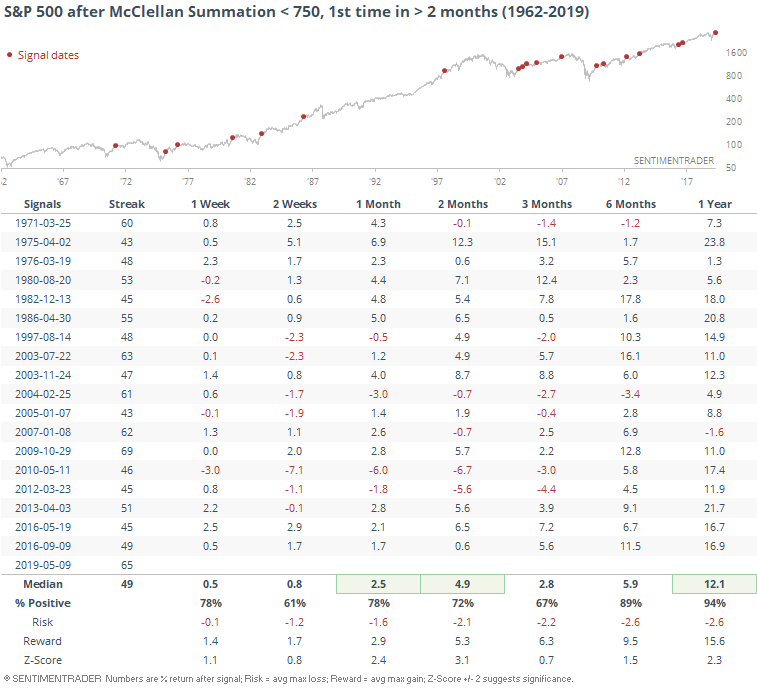
Long-Term Momentum
For the broader market, the weak breadth over the past week has been enough to push the McClellan Summation Index below 750. That's the first time in more than 3 months it's been below that threshold, a extremely long time. The last two times it did so, stocks saw some choppy action but resolved higher.
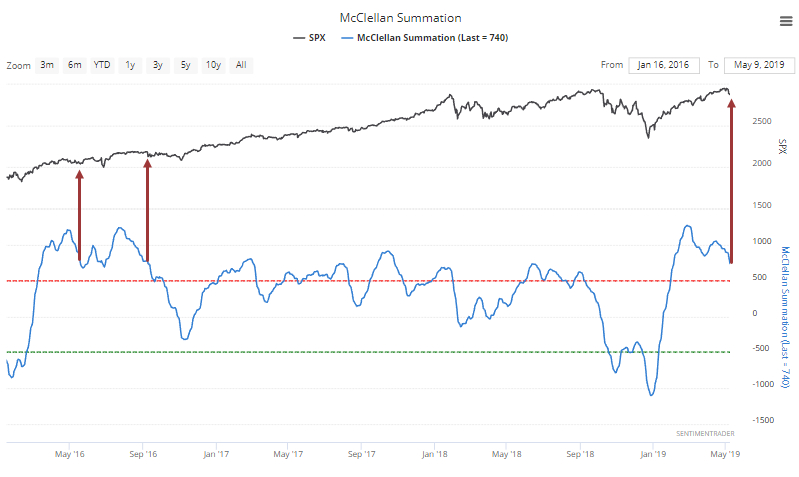
That's typically the pattern, but with even more of an upside bias.
Finally A Little Fear?
We saw earlier this week how options traders had become complacent. The drop on Thursday might have changed that a little bit, as the Total Put/Call Ratio jumped to 1.28, meaning there were 128 put options traded for every 100 call options.
The ratio had never been that high prior to 2003, and since then it's been a moderately good sign for stocks.
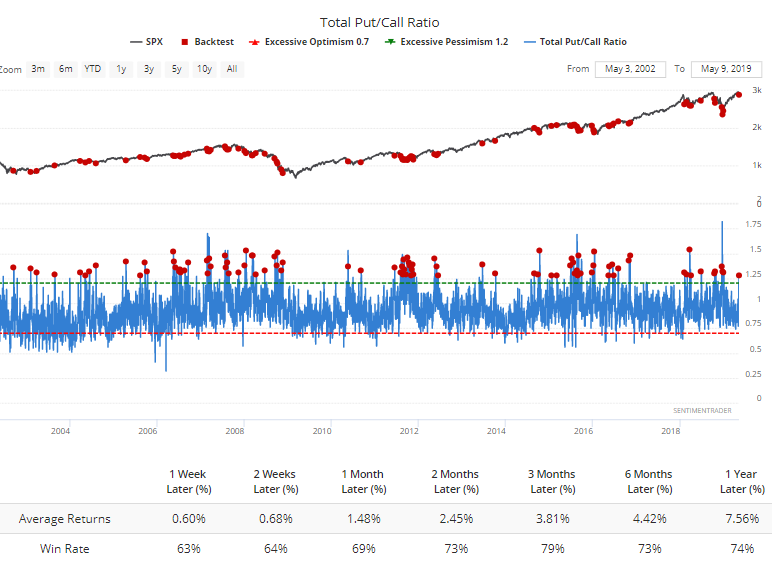
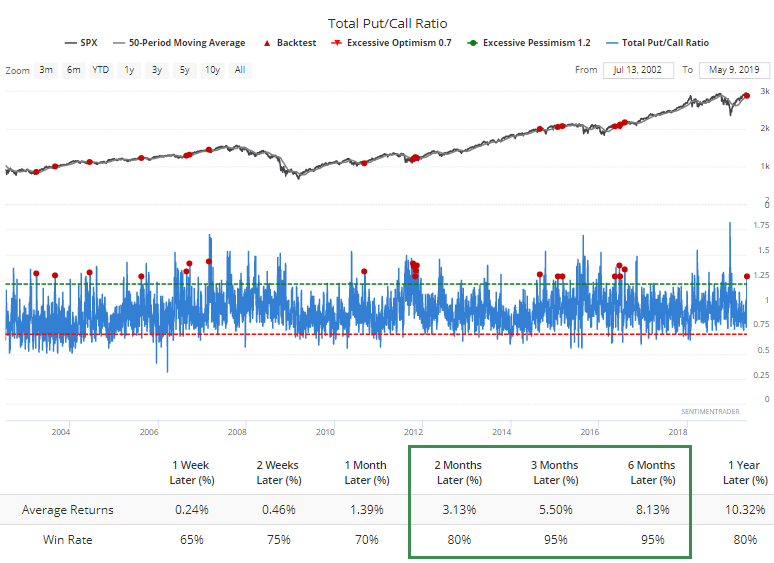
It was an even better sign when there was this many puts traded while the S&P 500 was still trading above its 50-day average.
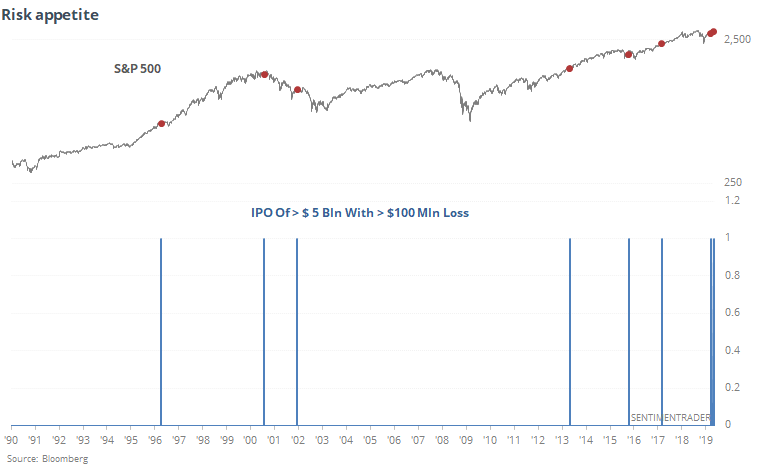
Risky
The Uber IPO is yet another sign that investors have almost unlimited appetite for risk on a long-term basis. While shorter-term there might be a little fear brewing, the bull market is allowing huge money-losing companies (in terms of market cap) to hoist their shares on the public. This is not a healthy sign long-term, especially if/when we see more in the coming month(s).