Data &
Technology
Research
Reports
Report Solutions
Reports Library
Actionable
Strategies
Free
Resources
Simple Backtest Calculator
Simple Seasonality Calculator
The Kelly Criterion Calculator
Sentiment Geo Map
Public Research Reports
Free Webinar
Pricing
Company
About
Meet Our Team
In the News
Testimonials
Client Success Stories
Contact
Log inLoginSign up
< BACK TO ALL REPORTS

Friday Midday Color

Jason Goepfert
2019-03-01
null

Here's what's piquing my interest so far today.

Momentum

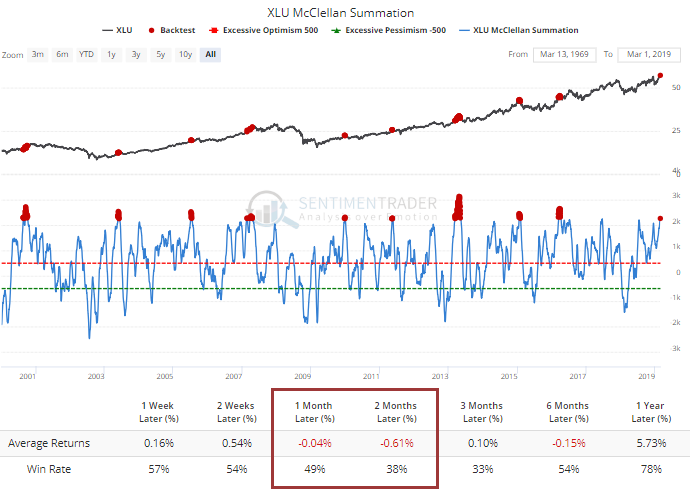
The level of breadth momentum across markets, index, and sectors is staggering. It has been so forceful and sustained that the McClellan Summation Indexes for several sectors are nearing multi-decade or all-time extremes. While often a good longer-term sign, it has been hard to sustain gains after moves like this.

Like in utilities.

And technology (no signals prior to the last 5 years).

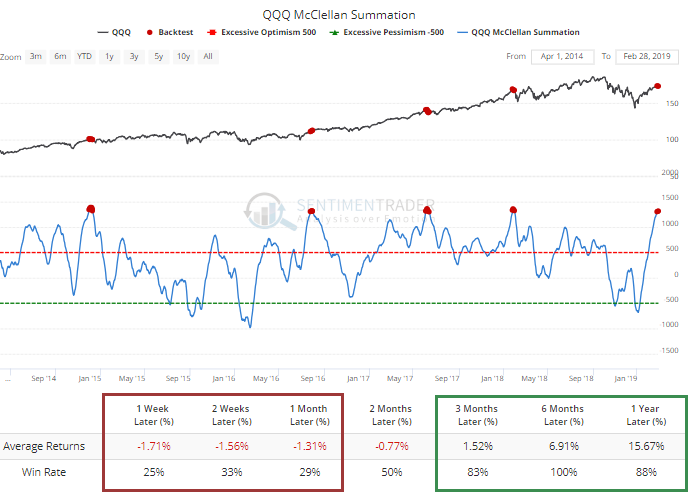
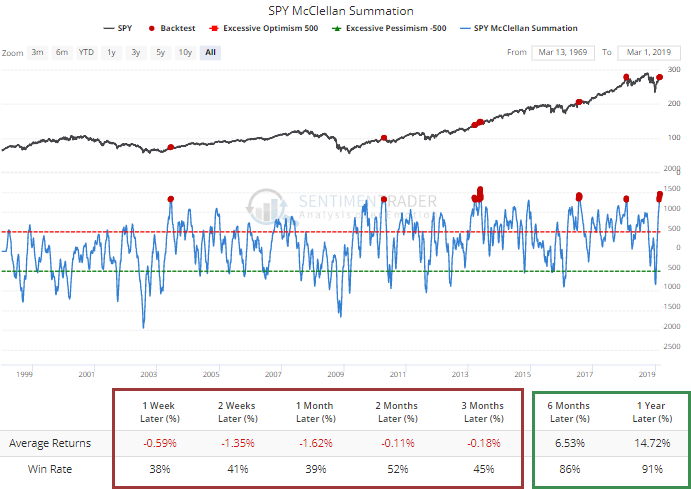
It's also at one of the most-stretched levels for the S&P 500 in 20 years.

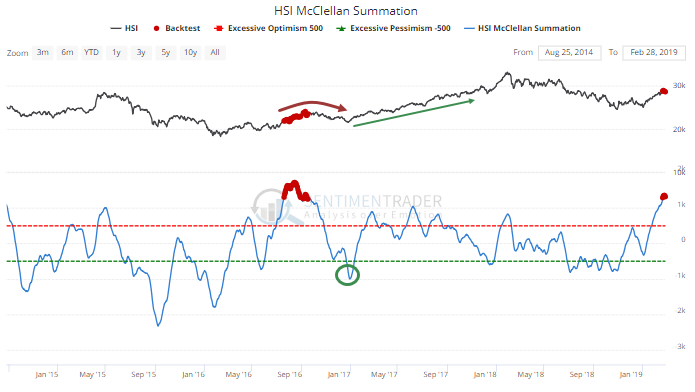
It's happened twice before in the Hang Seng index, first in 2011, which led to a rolling peak and substantial decline. Once the Summation Index cycled back down to -1000, a new uptrend took hold.

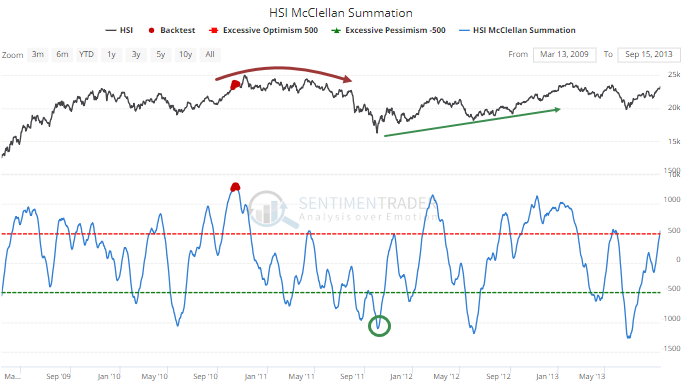
Something similar happened in 2016-17. Once it reached this level of overbought, the Hang Seng continued to gain in the month(s) ahead, but gave them all back. Once the Summation Index cycled down to -1000 again, the uptrend resumed in earnest.

No Sudden Movement

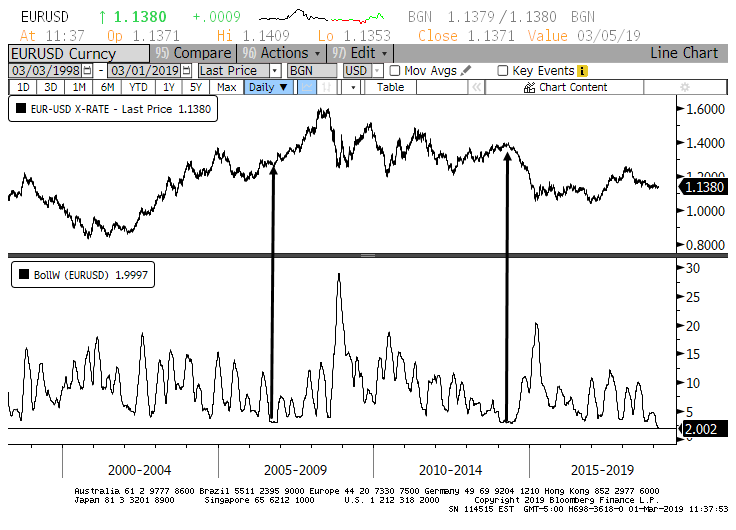
The WSJ noted that 30-day volatility in the EUR-USD cross is at a low point. It's not just the past 30 days. The volatility over the past 90 days is now the lowest on record. Two other times it got close, once leading to a large rally in the euro and the other a large decline. Volatility doesn't often predict movement, but it does tend to cycle from high to low, suggesting a big move either way in the months ahead.

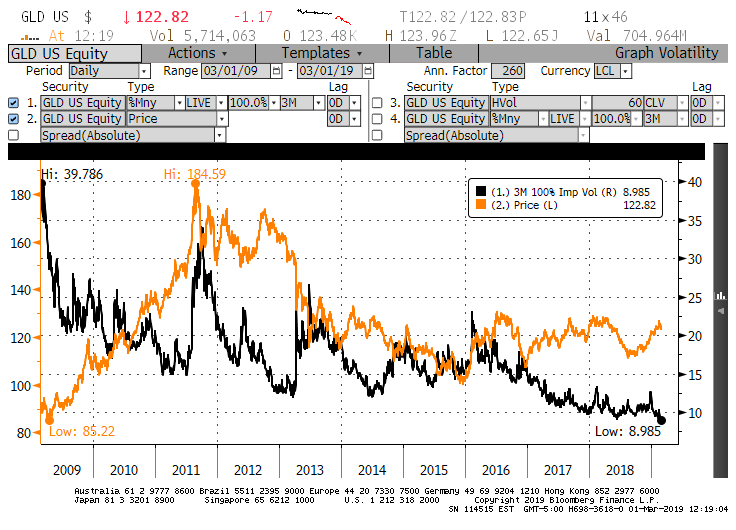
The WSJ also noted that implied volatility on the GLD gold fund is the lowest in a few years. It's actually the lowest in at least a decade. But unlike in stocks, implied volatility in other markets isn't very straightforward, with ebbs and flows occurring just as often during rallies as declines. There is a mentality that low volatility is bearish going forward (a habit from the stock market) but that hasn't been the case for GLD.

Exhaustion

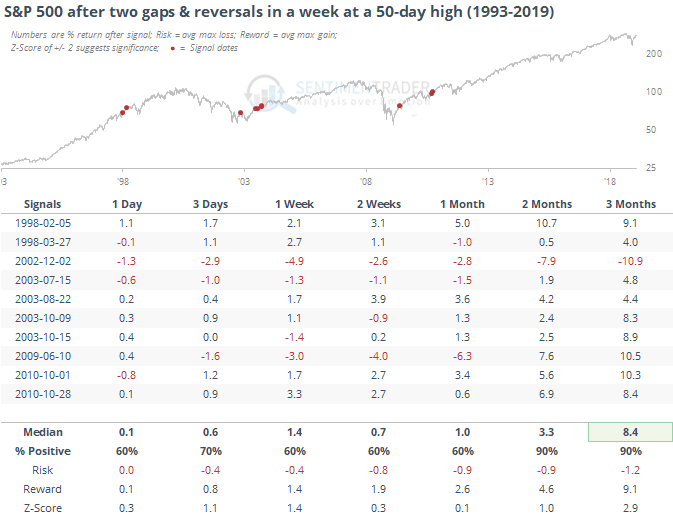
Stocks look exhausted here, as they're working on the 2nd gap up and intraday reversal in a week.

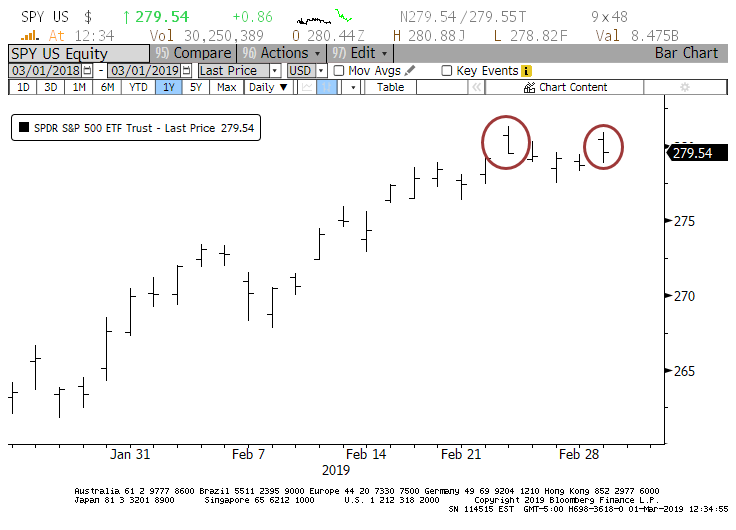
We should know better than to rely on looks, however, and that's the case here. Reversal patterns have not been reliable indications of future weakness.

Sorry, you don't have access to this report

Upgrade your subscription plan to get access
Go to Dasboard
DATA &
TECHnologies
IndicatorEdge
‍
BackTestEdge
‍
Other Tools
‍
DataEdge API
RESEARCH
reports
Research Solution
‍
Reports Library
‍
actionable
Strategies
Trading Strategies
‍
Smart Stock Scanner
‍
FREE
RESOUrCES
Simple Backtest
Calculator
Simple Seasonality
Calculator
The Kelly Criterion
Calculator
Sentiment Geo Map
‍
Public Research Reports
‍
Free Webinar
COMPANY
‍
About
‍
Meet our Team
‍
In the News
‍
Testimonials
‍
Client Success Stories
Pricing
Bundle pricing
‍
Announcements
‍
FAQ
© 2024 Sundial Capital Research Inc. All rights reserved.
Setsail Marketing
TermsPrivacyAffiliate Program
Risk Disclosure: Futures and forex trading contains substantial risk and is not for every investor. An investor could potentially lose all or more than the initial investment. Risk capital is money that can be lost without jeopardizing ones’ financial security or life style. Only risk capital should be used for trading and only those with sufficient risk capital should consider trading. Past performance is not necessarily indicative of future results.

Hypothetical Performance Disclosure: Hypothetical performance results have many inherent limitations, some of which are described below. No representation is being made that any account will or is likely to achieve profits or losses similar to those shown; in fact, there are frequently sharp differences between hypothetical performance results and the actual results subsequently achieved by any particular trading program. One of the limitations of hypothetical performance results is that they are generally prepared with the benefit of hindsight. In addition, hypothetical trading does not involve financial risk, and no hypothetical trading record can completely account for the impact of financial risk of actual trading. for example, the ability to withstand losses or to adhere to a particular trading program in spite of trading losses are material points which can also adversely affect actual trading results. There are numerous other factors related to the markets in general or to the implementation of any specific trading program which cannot be fully accounted for in the preparation of hypothetical performance results and all which can adversely affect trading results.

Testimonial Disclosure: Testimonials appearing on this website may not be representative of other clients or customers and is not a guarantee of future performance or success.