Friday Midday Color

Here's what's piquing my interest so far today.
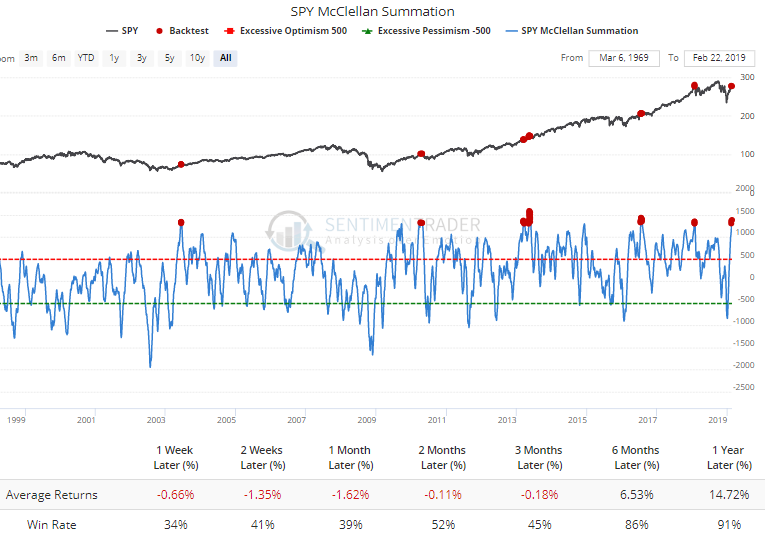
Looking through long-term breadth momentum for sectors and indexes, it's remarkable how many are showing a McClellan Summation Index above 1,000.
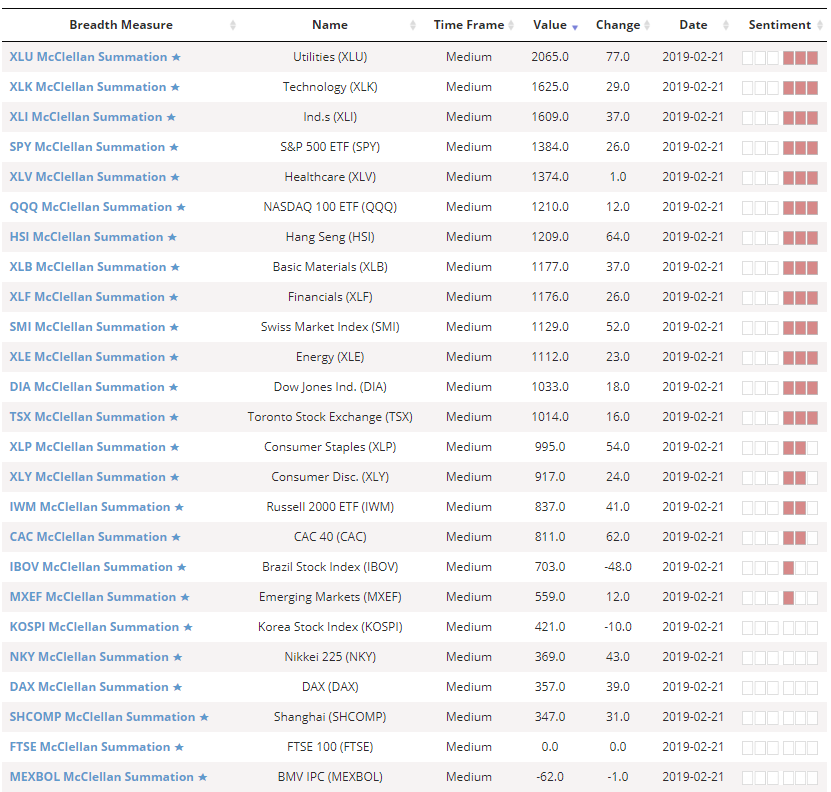
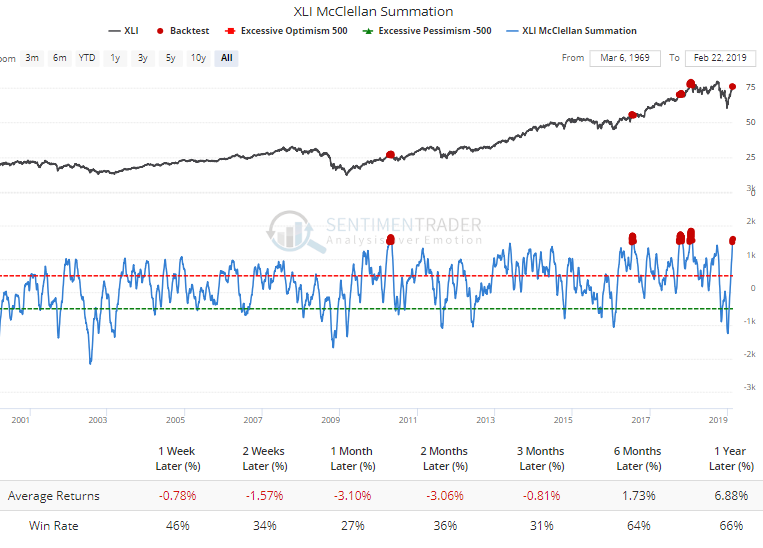
If we use the Backtest Engine, we can see that these extremes are getting to the point that typically signal exhaustion, or at least relatively poor shorter-term returns. For many, it was a good long-term sign of intense and widespread buying interest.
For Industrials:
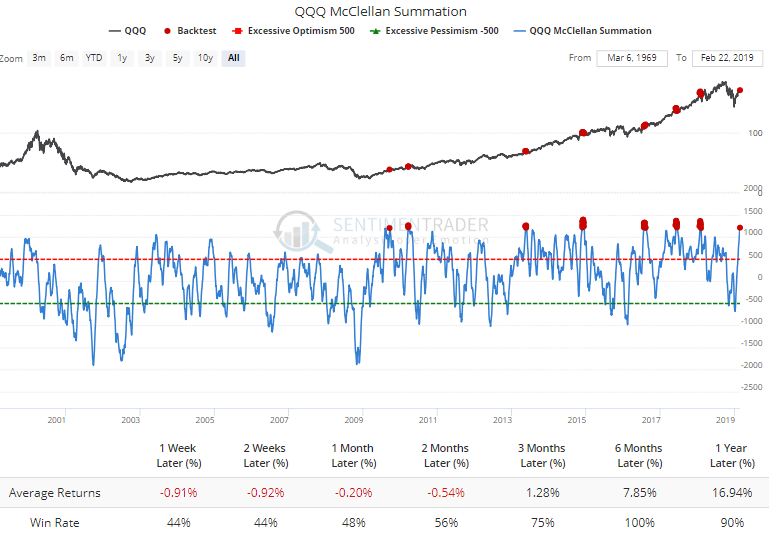
And the Nasdaq 100:
And S&P 500:
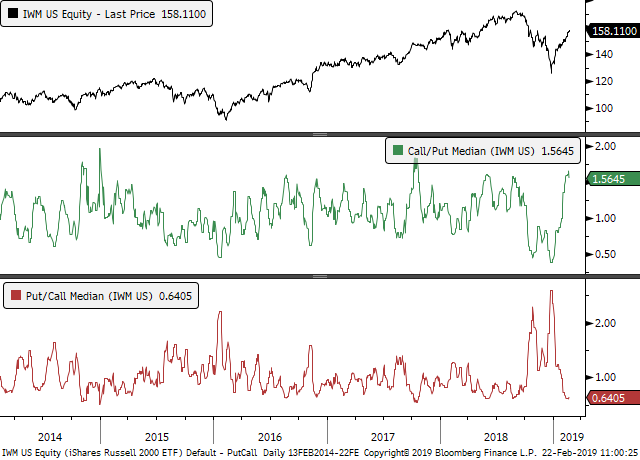
One of the extremes we looked at in late December was the explosion in puts in indexes like IWM, matching what was seen at the lows in 2009. Times have changed and now calls are being favored. It's not as extreme in other major indexes, though.
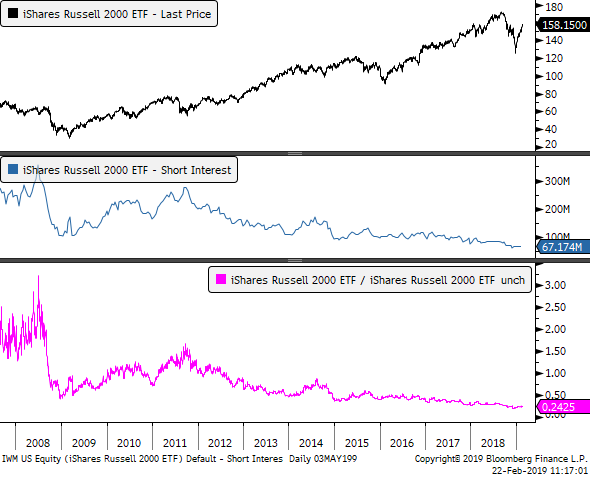
There isn't much for short interest, either - not that that's stopped it in the past. Just less potential fuel.
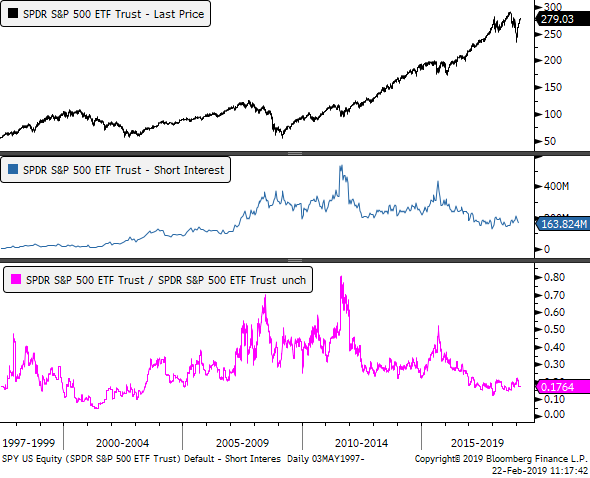
It's the same for SPY.
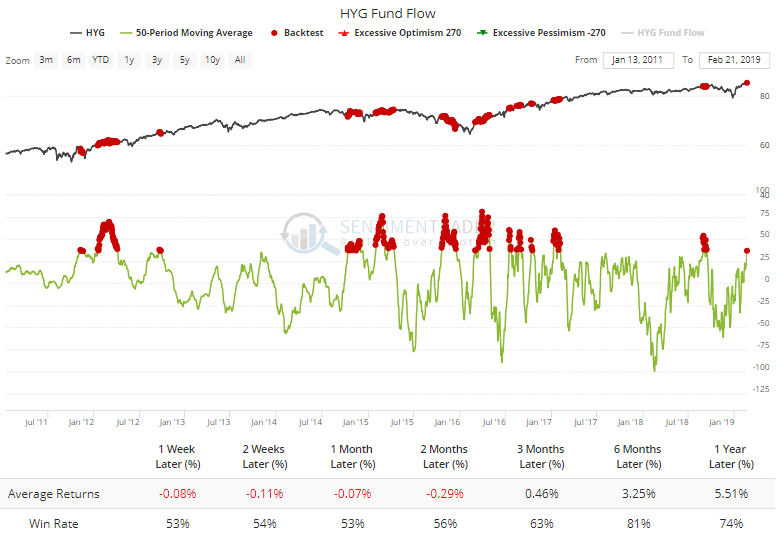
High-yield bonds have been on an absolute tear, and ETF traders have taken notice. Over the past 50 days, HYG has taken in an average of $36 million per day. It's gotten quite a bit more extreme, and future returns were positive more often than not, but the average return was negative in the shorter-term.
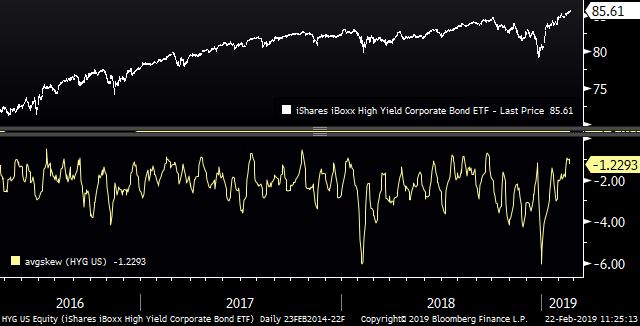
Options traders are paying up for potential upside participation, too, after panicking at the lows. Put/call skew on HYG is on the upper end of its range.
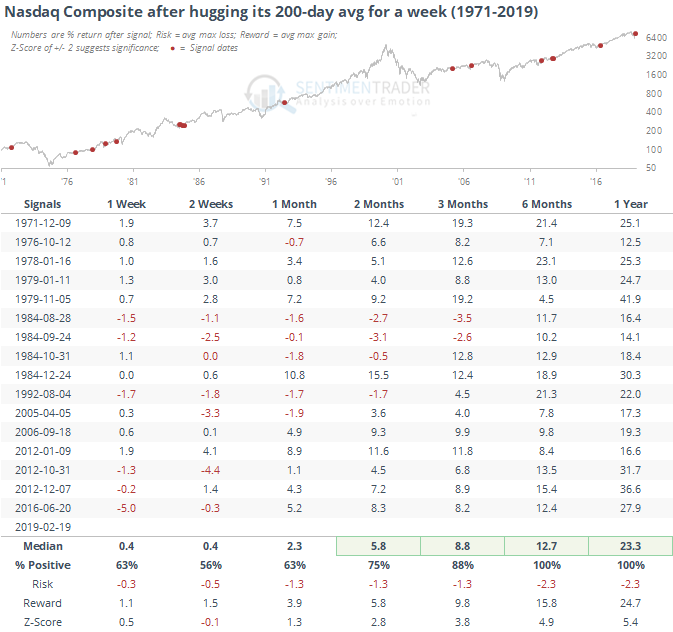
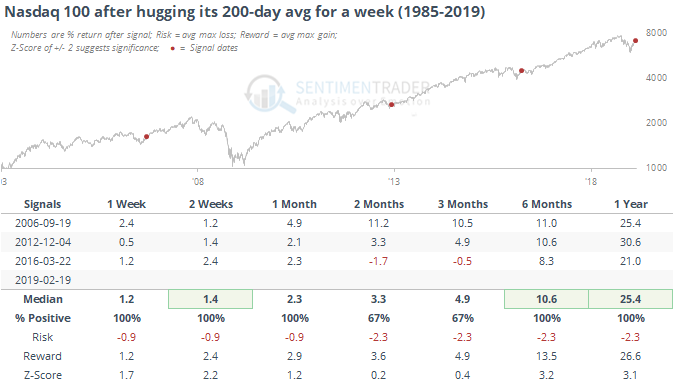
Whatever the negatives, buyers have shown no interest in letting up for more than a day. For indexes like the Nasdaq 100, there seems to be some indecision as the index has hugged its 200-day average for 8 days now, moving no more than 0.5% away from it. The only time in its history it has done that was in 2016. When it's gone on for at least a week, it led to good returns, as much as we can read into a sample size of 3.
While not hugging its 200-day quite as tight, the broader Nasdaq Composite has done the same thing. Again, very positive medium- to long-term returns.