Products
SentimenTrader Trading Tools
‍
Backtest Engine
My Trading Toolkit
Correlation Analysis
Seasonality
Indicators & Data API
‍
Proprietary Indicators & Charts
Market Data API
Strategies & Scanner
‍
50+ Trading Strategies
Smart Stock Scanner
Research Reports
‍
Research Solutions
Reports Library
Free Resources
Simple Backtest Calculator
Simple Seasonality Calculator
The Kelly Criterion Calculator
Sentiment Geo Map
Public Research Reports
Education
Sentiment Indicators
Technical Indicators
Pricing
Company
About
In the News
Testimonials
Client Success Stories
Contact
Log inLoginSign up
< BACK TO ALL REPORTS

Friday Color - Wipeout, Extremes, HiLo Too High

Jason Goepfert
2019-08-23
null

I'm technically out of the office today, but with the volatility wanted to touch on a couple of things. We were humming along fine, until the renewed bout of chest-pounding hit the tape and now stocks are suffering relatively large losses.

Friday Wipeout

There is a concern that a big wipeout on a Friday sets us up for a crash kind of scenario on Monday's. I can't remember how many times we've looked at that kind of thing over the years, but it has to be dozens. None of them panned out, like usual. Even 30 years later, the specter of 1987 hangs over investors.

Who knows how the trade rhetoric will ramp up in the day(s) ahead, and it's a real risk. As far as price action is concern, this is a fairly unusual situation, with Friday wiping out what had been more than a 1% gain through Thursday. That happened several times in the 1930s, but not at all from 1950 through the mid-1980s. Since then, we can see the dates in the table below.

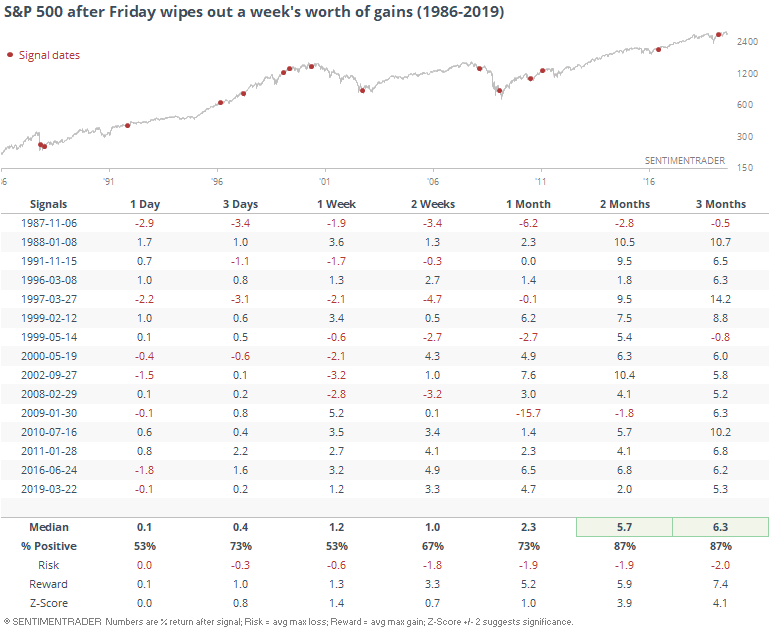
None of them preceded a very large drop, but there were smattering of lesser ones in there. Mostly, the week-ending panic led to bounces. For what it's worth in the age of setting policy via off-the-cuff tweets.

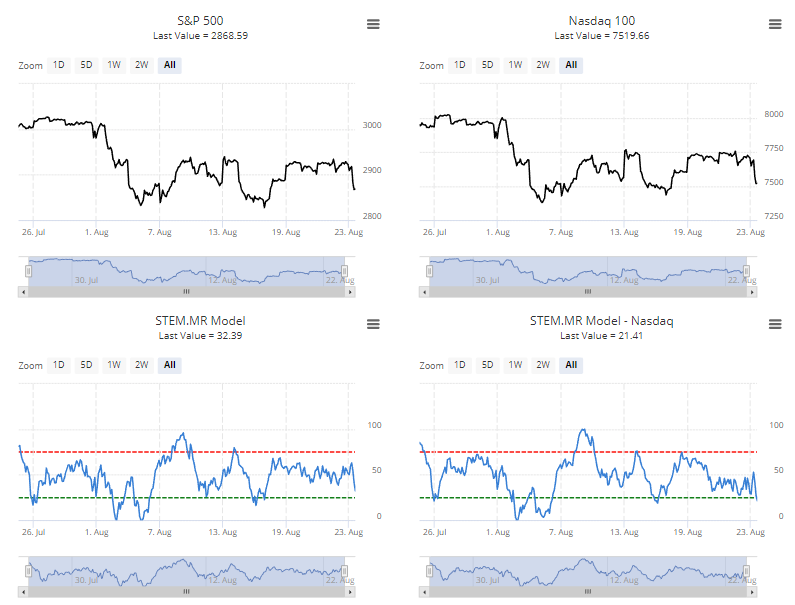
The intraday drop has been enough to push the shortest-term indicators toward extremes, but not enough yet to really reach oversold levels.

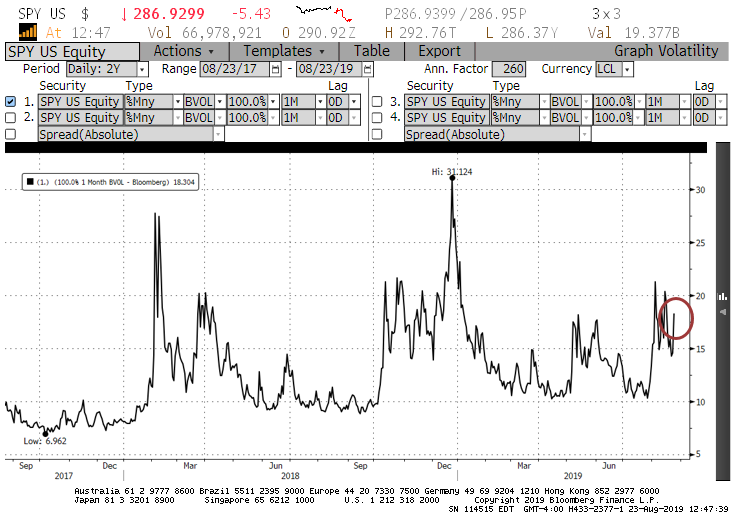
As far as "fear" goes, there has been uptick in the prices traders are willing to pay for puts versus calls on SPY, but it's not anywhere near extreme levels.

Mostly Positive

Troy has been going over some core fundamental and momentum indicators recently, and they're still almost all pointing higher for stocks. Most of the other sentiment and breadth indicators we've looked at over the past couple of weeks do so as well.

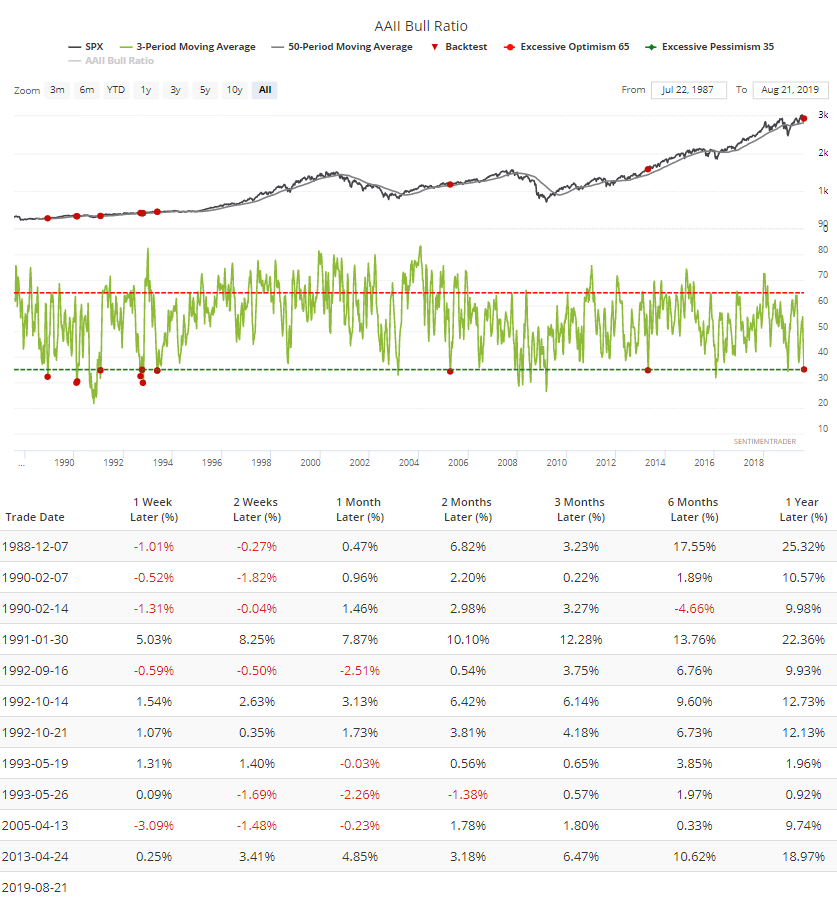
Adding to the pile, the latest AAII survey dropped the 3-week average to an exceptionally low number of bulls.

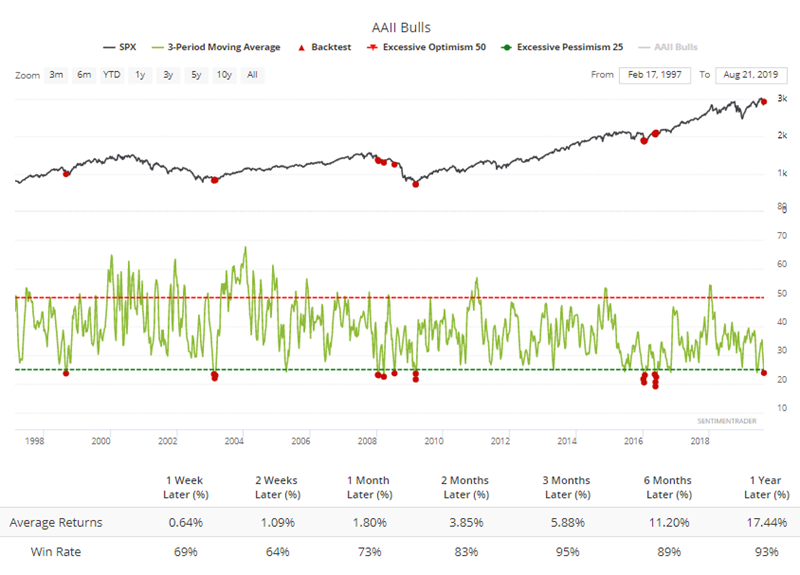
Bears are high, too, so the Bull Ratio has receded to one of the lowest levels ever when the S&P was trading above its 50-week average at the time.

Except For The "Split"

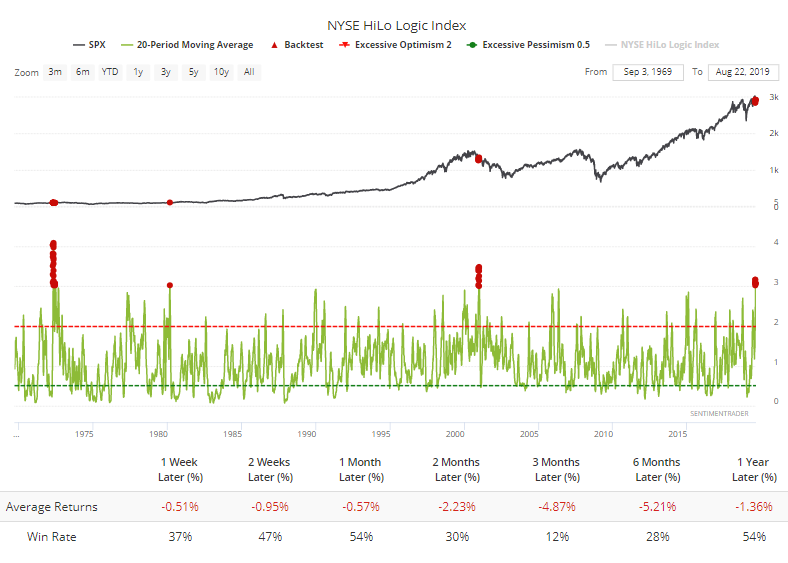
About the only negative we've look at is still a concern. Despite the losses today, the NYSE is showing more than 100 securities that have hit a 52-week high, and also more than 100 hitting a 52-week low. That's more than 4% of total issues, so the HiLo Logic Index is soaring again, meaning that we're in the midst of a very split market.

The 20-day average of that indicator is now above 3, something that has rarely been seen since 1962. Returns in stocks after the other three instances were not good.

If we relax the parameters to a 20-day average of 2.5% or higher, there were more signals but returns didn't improve much.

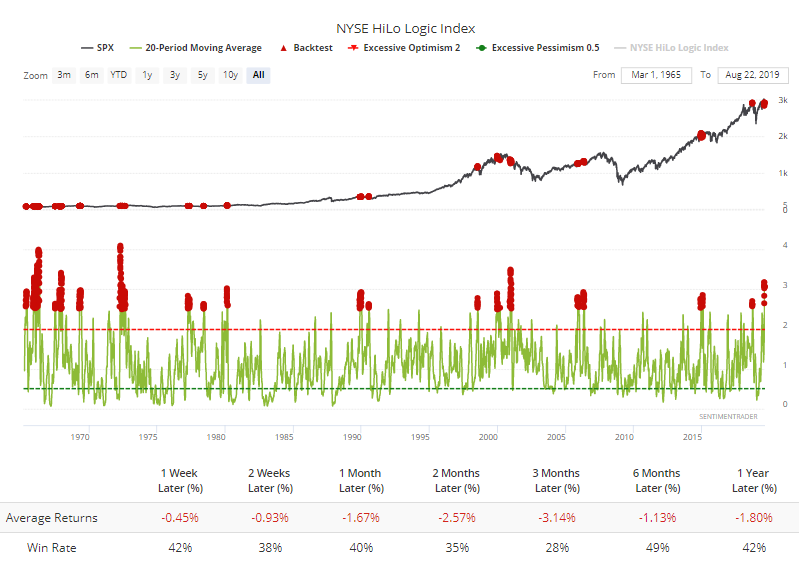
 It's hard to say whether this is enough to derail what has been a pretty heavily skewed positive picture. I don't think it is, not yet, but it's definitely a worry.

Sorry, you don't have access to this report

Upgrade your subscription plan to get access
Go to Dasboard
PRODUCTS
SentimenTrader
Trading Tools
Indicators & Data API
‍
Strategies & Scanner
‍
Research Reports
FREE
RESOUrCES
Simple Backtest
Calculator
Simple Seasonality
Calculator
The Kelly Criterion
Calculator
Sentiment Geo Map
‍
Public Research Reports
‍
Education
Sentiment Indicators
‍
Technical Indicators
‍
Pricing
Bundle pricing
‍
FAQ
‍
Announcements
‍
COMPANY
‍
About
‍
In the News
‍
Testimonials
‍
Client Success Stories
CONTACT
‍
General Inquiries
‍
Media Inquiries
‍
Financial Professionals Inquiries
‍
© 2025 Sundial Capital Research Inc. All rights reserved.
Setsail Marketing
TermsPrivacyAffiliate Program
Risk Disclosure: Futures and forex trading contains substantial risk and is not for every investor. An investor could potentially lose all or more than the initial investment. Risk capital is money that can be lost without jeopardizing ones’ financial security or life style. Only risk capital should be used for trading and only those with sufficient risk capital should consider trading. Past performance is not necessarily indicative of future results.

Hypothetical Performance Disclosure: Hypothetical performance results have many inherent limitations, some of which are described below. No representation is being made that any account will or is likely to achieve profits or losses similar to those shown; in fact, there are frequently sharp differences between hypothetical performance results and the actual results subsequently achieved by any particular trading program. One of the limitations of hypothetical performance results is that they are generally prepared with the benefit of hindsight. In addition, hypothetical trading does not involve financial risk, and no hypothetical trading record can completely account for the impact of financial risk of actual trading. for example, the ability to withstand losses or to adhere to a particular trading program in spite of trading losses are material points which can also adversely affect actual trading results. There are numerous other factors related to the markets in general or to the implementation of any specific trading program which cannot be fully accounted for in the preparation of hypothetical performance results and all which can adversely affect trading results.

Testimonial Disclosure: Testimonials appearing on this website may not be representative of other clients or customers and is not a guarantee of future performance or success.