Friday Color - Lows Recede, Summation Rollover, Bad Ag, Bond Bulls (Again)

Here's what's piquing my interest as traders deal with another tremor on trade tweets.
Recovering
When monitoring for extremes, there are typically three strategies for implementation:
1. When it first registers an extreme
2. When it registers an extreme, then price triggers a technical entry
3. When it registers an extreme, then starts to recover
There is no right answer, as each of them have their pluses and minuses. It all depends on probability of gain, amount of likely risk, time frame, etc.
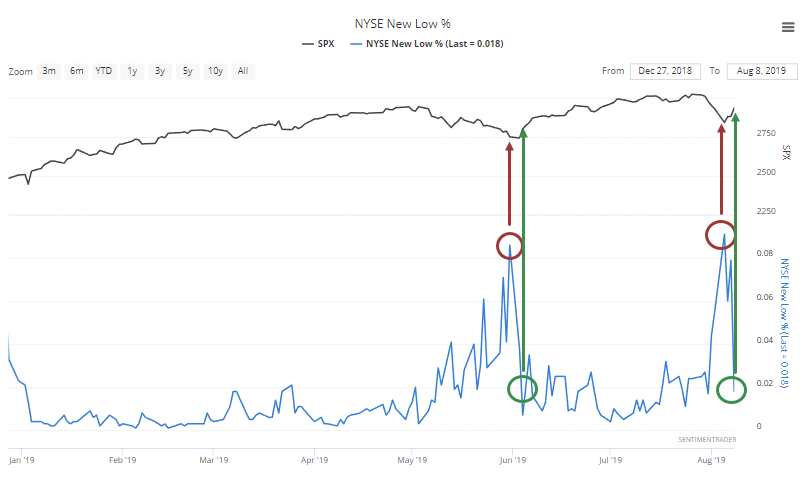
Earlier this week, we saw that the number of 52-week lows on the NYSE ballooned to more than 9% of all securities. Coming so soon after a high in the S&P 500, this has not been an immediate contrary indicator. Often, it has led to more selling pressure.
But already, it has reversed by a large degree, and by Thursday, fewer than 2% of issues had hit a 52-week low. When that happened in May, it suggested the selloff was over.
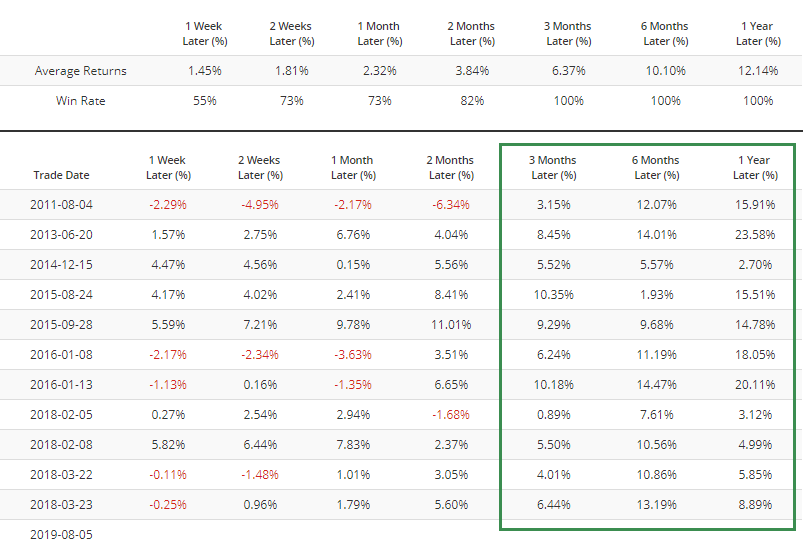
Historically, this has been a pretty safe bet. When new lows reverse this much within a week's time, future returns were good. There were some false starts, like in May 2010 and July 2015, though.
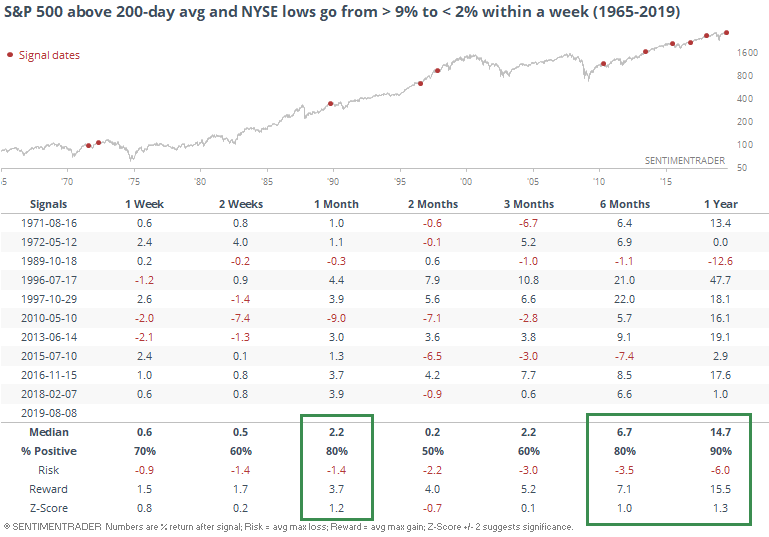
When it happened while the S&P was relatively near its peak, there were only a handful of precedents, almost all since the financial crisis.
None of them really took off to the upside, each with a negative return somewhere between 2-8 weeks later. But the losses tended to be relatively muted.
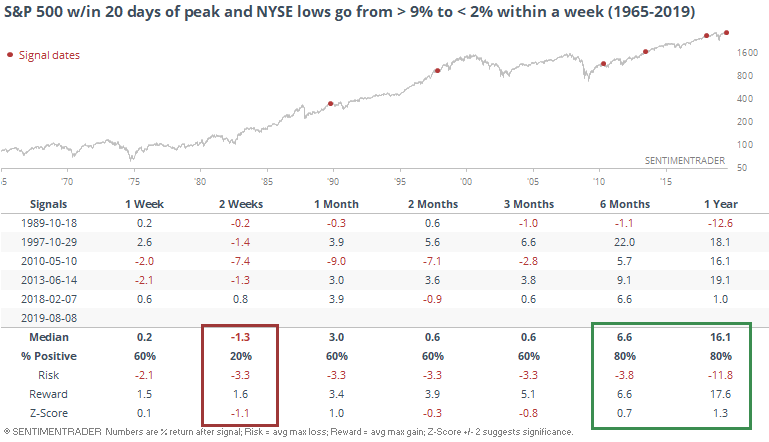
If we look at magnitude instead of time from peak, there were also only a handful.
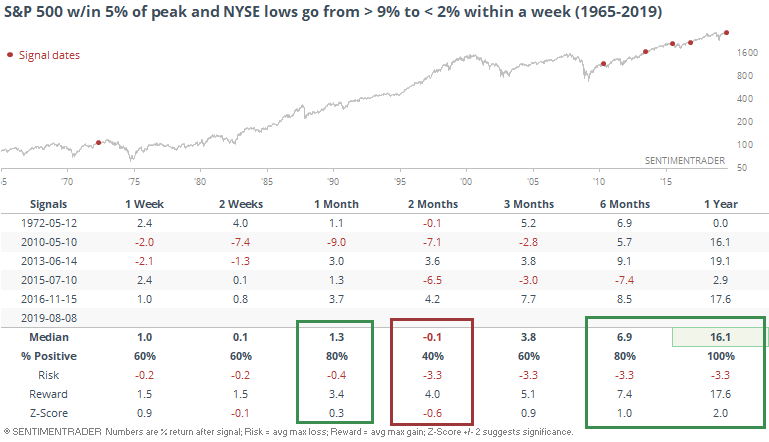
Overall, the quick drop in new lows may be a longer-term positive sign, but doesn't say much about the shorter-term.
Losing Momentum
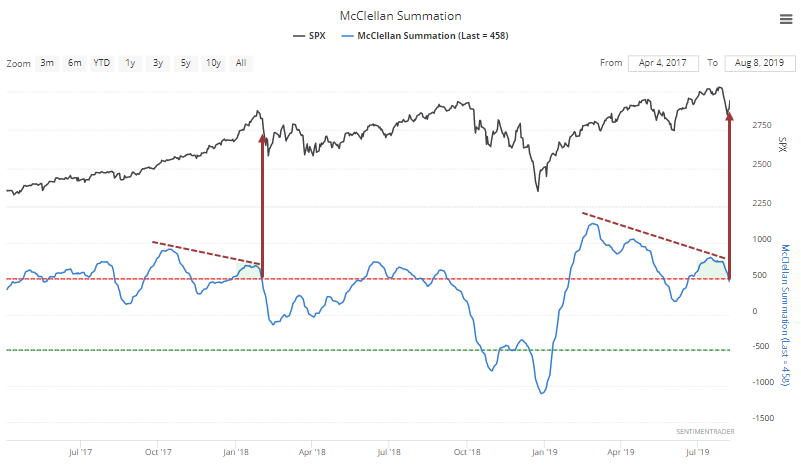
One potential negative is that long-term momentum underlying the market is waning. After spiking earlier this year, the McClellan Summation index hasn't been able to generate much oomph, and has now crossed below +500 after holding above it for only a little over 30 days.
This has led to some trouble in the past, mostly shorter-term.
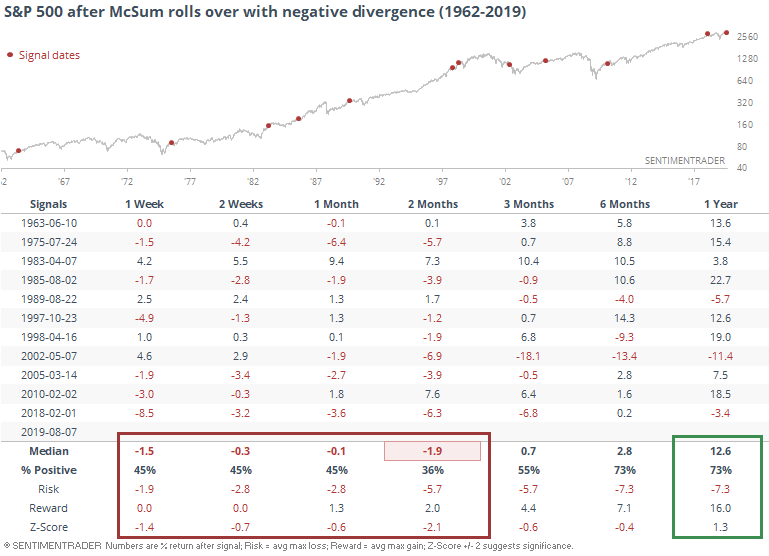
The only one to lead to a very large decline, though, was in 2002, and it's hard to equate our current conditions with that one. Two of them led to losses as large as -10% at some point over the next six months, while four of them preceded gains of at least +10%. Not a major difference, but does suggest a slightly positive probability of large gain vs large loss.
Sliding Again
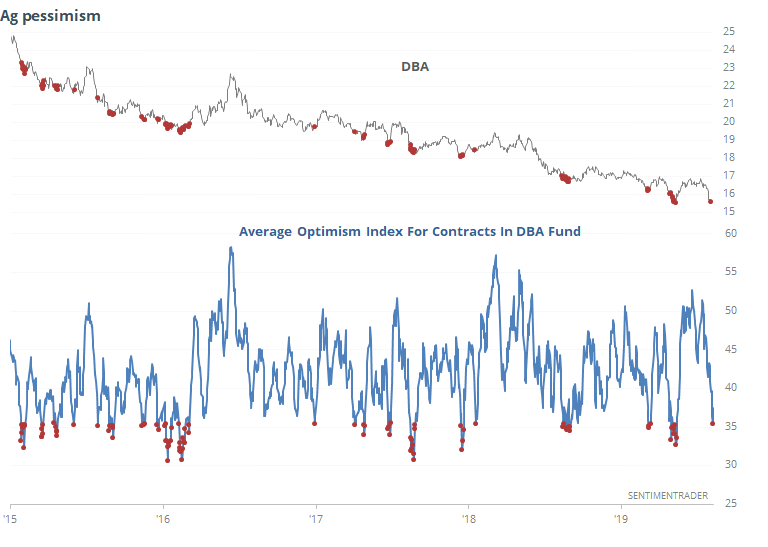
Trade concerns have weighed on ag contracts again, and popular funds like DBA have resumed a fall that has been relentless over the past five years. It's one of the most persistent and severe declines across all markets.
The average Optimism Index for the contracts in the DBA fund has dropped significantly in recent weeks and is nearing an extreme level. That was good for indicating a bottoming process prior to the last 5 years, but since then, not so much.
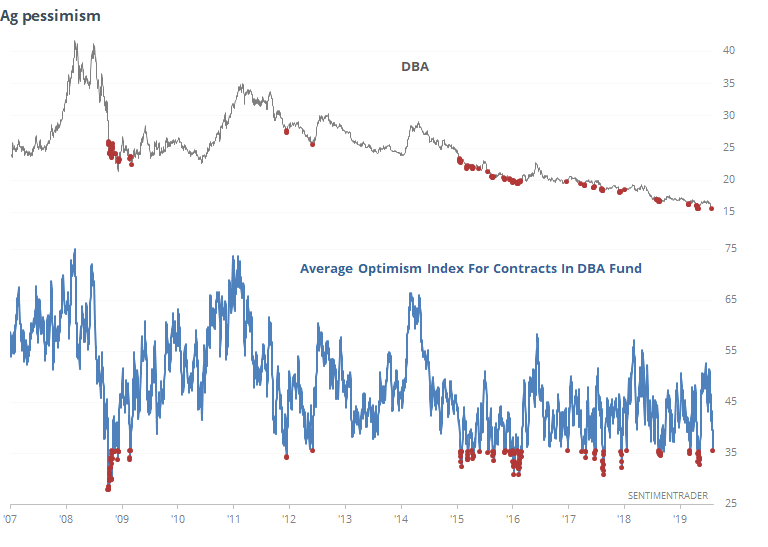
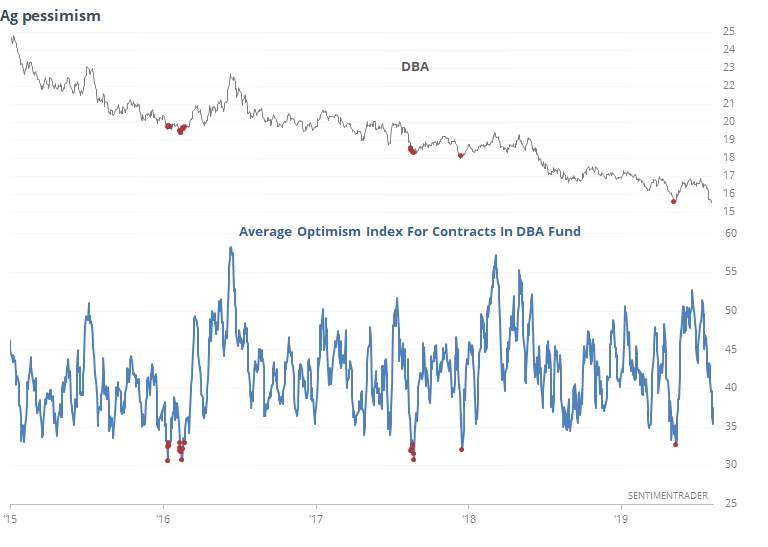
If we zoom in just on the past five years, we can see that a reading this low preceded a decent chance for a shorter-term bounce, but not much more than that.
The current average is 35.5%. If it drops to 33% or below, it has had a better shot at a more lasting recovery. Another week like the past week could be enough to push it low enough to register that kind of pessimism across the contracts.
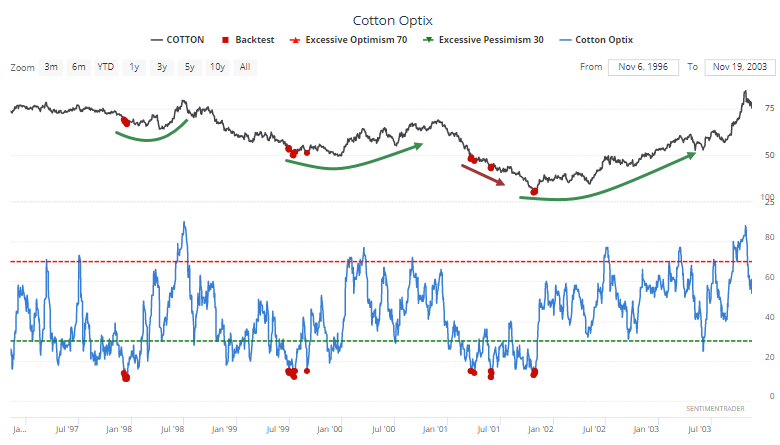
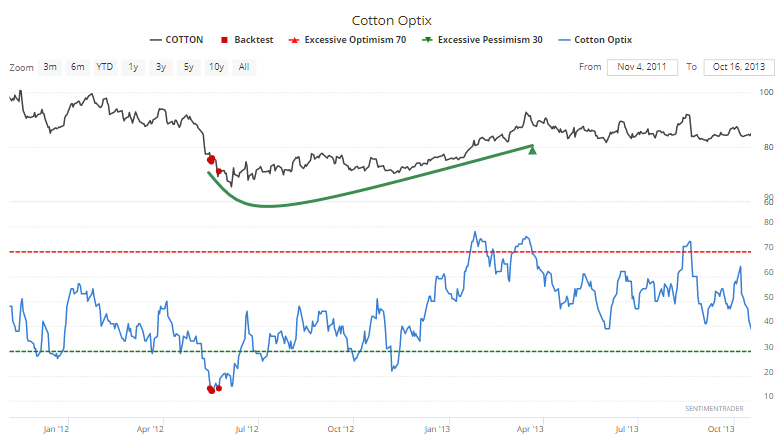
The most hated among them is cotton.
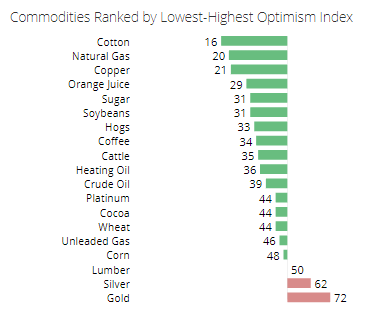
This week, cotton's Optimism Index dropped to 15%. its worst in 7 years. Going back to 1991, there have been only a handful of days it was this low. Only the readings from early 2001 didn't result in a bottoming process.
Upper Bound
Unlike other markets, bonds have - at some point - a natural upper bound. Interest rates can only go so low. That theory is being sorely tested now, as we're seeing perhaps the most unusual investment climate for bonds in the history of civilization.
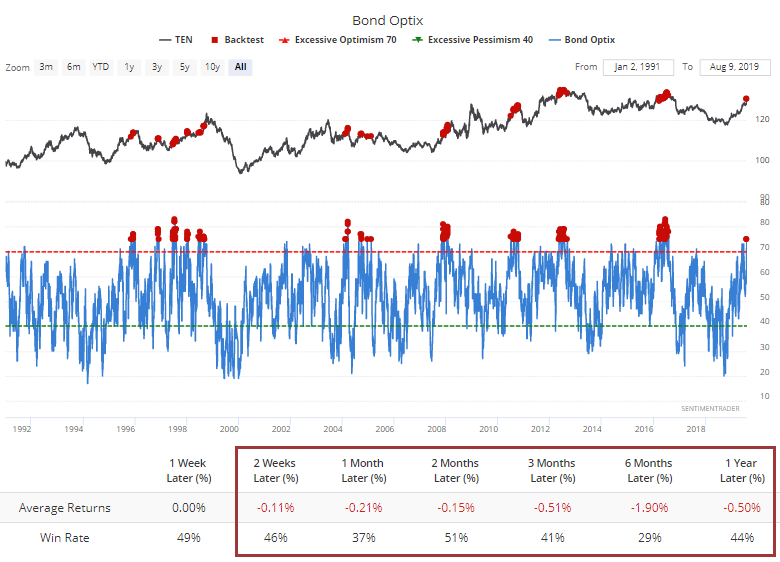
If we make the increasingly shaky assumption that there is some kind of limit to bond rallies, then it should become more and more of a worry as optimism inches higher. The Bond Optimism Index has now moved to 75%, the highest since that market peaked three years ago. It has been exceptionally difficult for 10-year T-note futures to add to its price gains after readings this high.
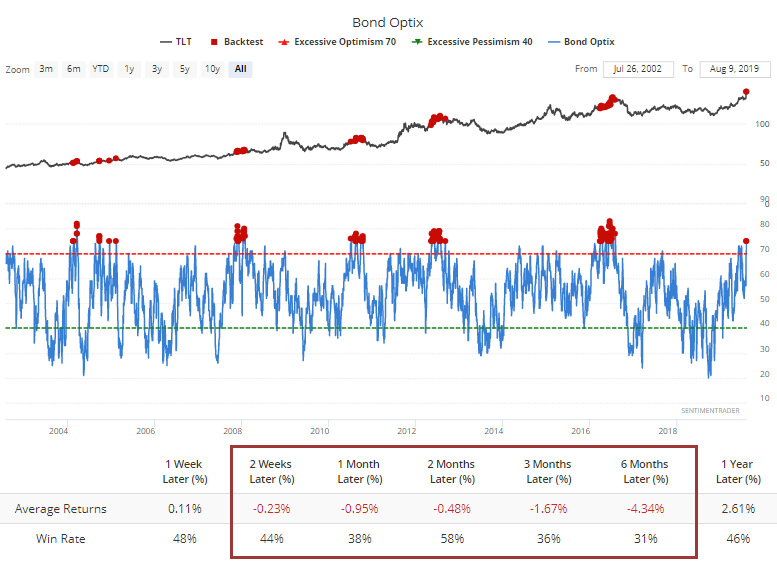
Same for TLT.
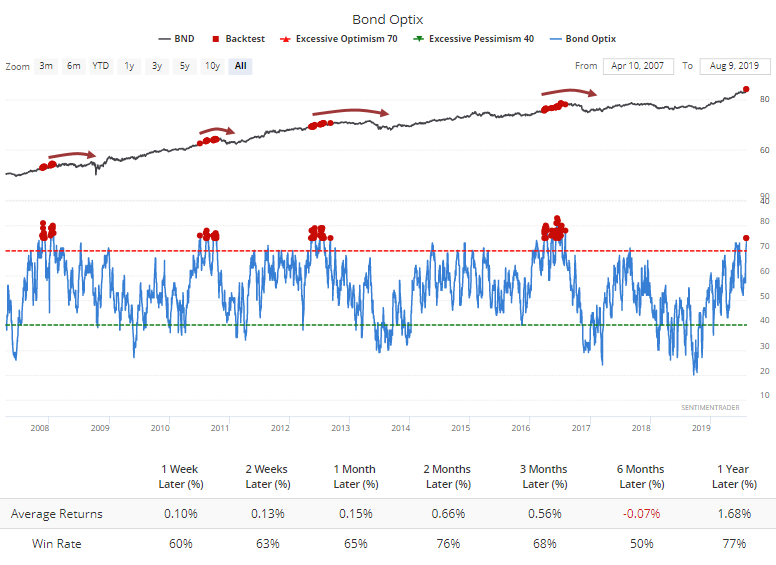
Broader bond funds fared much better because they have exposure to mortgages, munis and other corners of the market. Even so, price returns were muted, and eventually led to corrective periods in funds like BND.
Short-Term Extreme
I missed this on Monday, but the Short-Term Combined Model plunged to one of the lowest levels on record. This is a model Eric created which used machine learning to combine some of the more reliable short-term models and indicators we show on the site.
It's meant as a short-term mean-reversion strategy, and that ship has already sailed. But it's worth pointing out that the reading was low enough that it preceded longer-term recoveries, with only two (temporary) losses 2 months later.
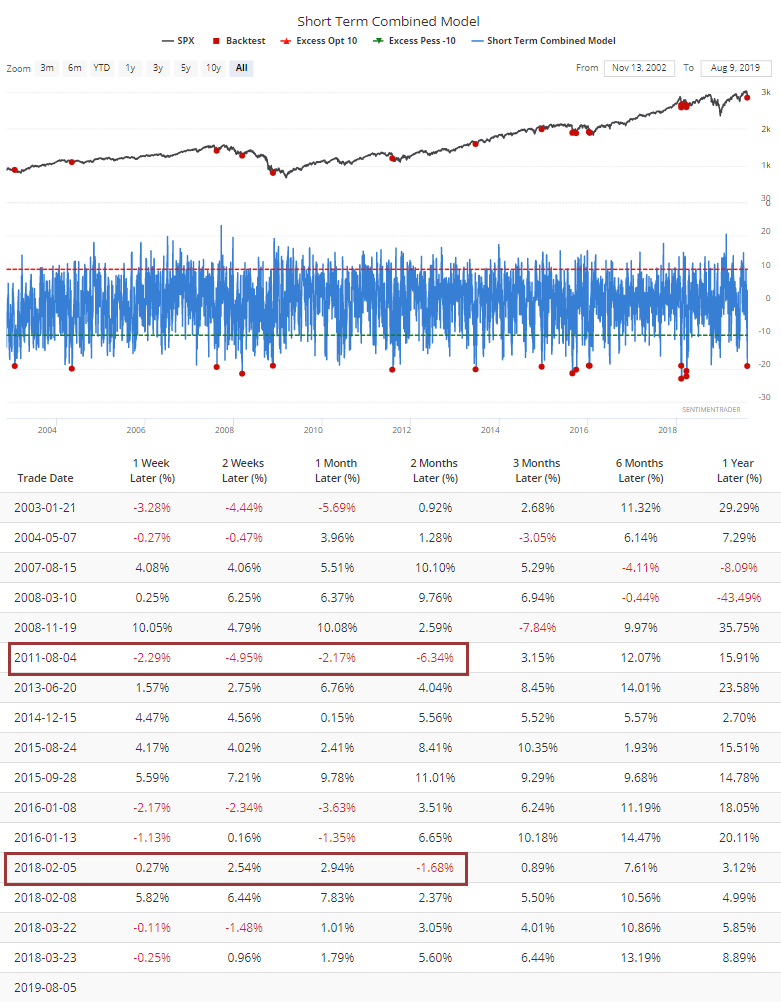
Since the financial crisis, 3-month+ returns have been pristine.