Friday Color - Equity Outflow, Breadth High, Oscillator Extremes, Mexico Rebound, Dollar Pain

A Daily Report won't be published today, so we're sending this Bulletin. This is what a typical premium note would contain. I post a note during most trading days, and Troy does as well after U.S. hours.
We've also unlocked all other premium posts from this week:
- Friday - Switching from stocks to gold, year-to-date analogs, manufacturers' orders, nascent copper rally, persistently inverted curve
- Thursday - German DAX earnings, high put/call ratios, all or nothing breadth days, silver:gold ratio, the Aussie's bad stretch
- Wednesday - Stocks vs bonds, MACD impulse sell, minimum volatility ETF flow, energy sector sentiment, gold RSI
- Wednesday - CNN model showing fear, chemical activity barometer, silver surge, stock skew
- Tuesday - Social pessimism, Brazil breadth, ag risk
- Tuesday - Chicago Fed activity, S&P 500 vs its 200-day average and components, swinging in a range, Treasury RSI, Germany sentiment
- Monday - Gaps, a volatile month, assets after high economic uncertainty, materials sentiment, signs of pessimism
- Weekend - Troy's technical and fundamental overview
No Bet
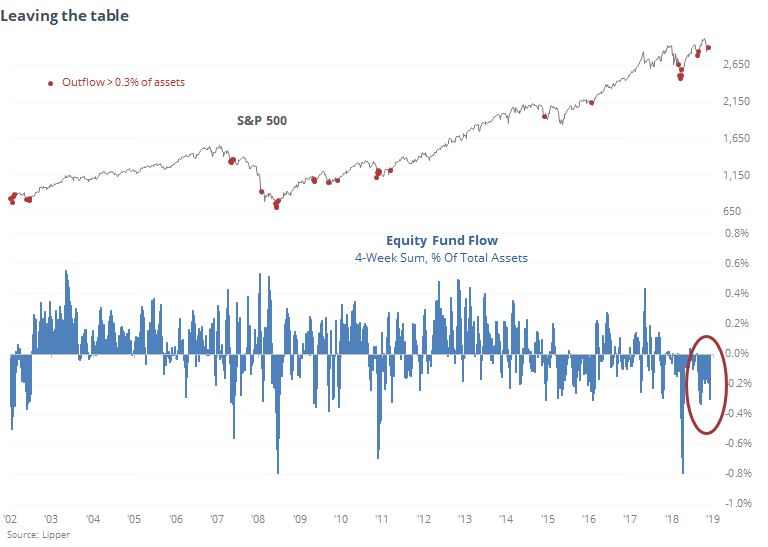
According to Lipper, investors continue to shed their equity assets. Over the past 4 weeks, investors have pulled more than $40 billion from equity mutual funds and ETFs. That's more than 0.3% of total equity holdings, which doesn't seem like much, but...
Not only is the 4-week total outflow extreme, we can see that it's been consistently negative. So much so that the 52-week total is nearing 2% of total fund assets, the most since the end of the 2002 bear market.
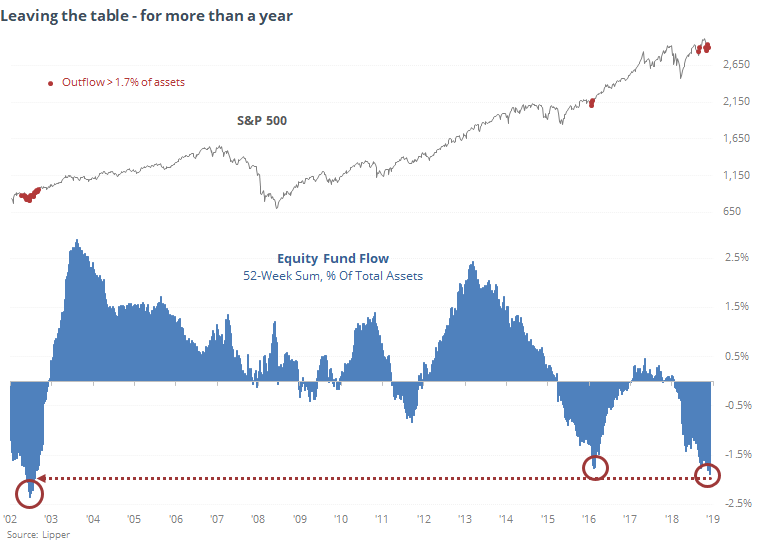
If one wanted to be a longer-term contrarian bull, it's hard to find a more compelling argument than this.
Liquidity, Baby
The NYSE Advance/Decline Line is likely to hit a fresh high on Friday, if the positive morning vibes continue through the day. Given the tendency to see a (very!) light-volume, positive bias before major exchange holidays, that seems likely. It did a similar thing by hitting a high while the S&P 500 was well below its own high, but on a larger scale, earlier this year.
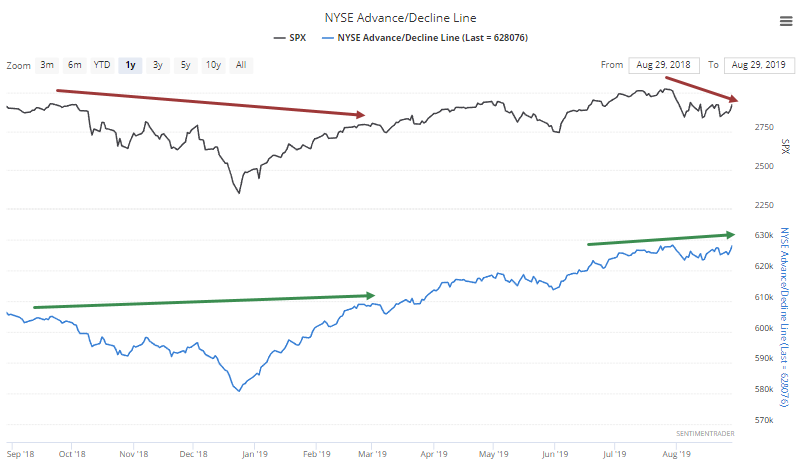
When the A/D Line is leading, it suggests ample liquidity in the market, as investors are consistently buying a broad array of securities. And that kind of liquidity injection tends to keep going. Momentum is tough to kill.
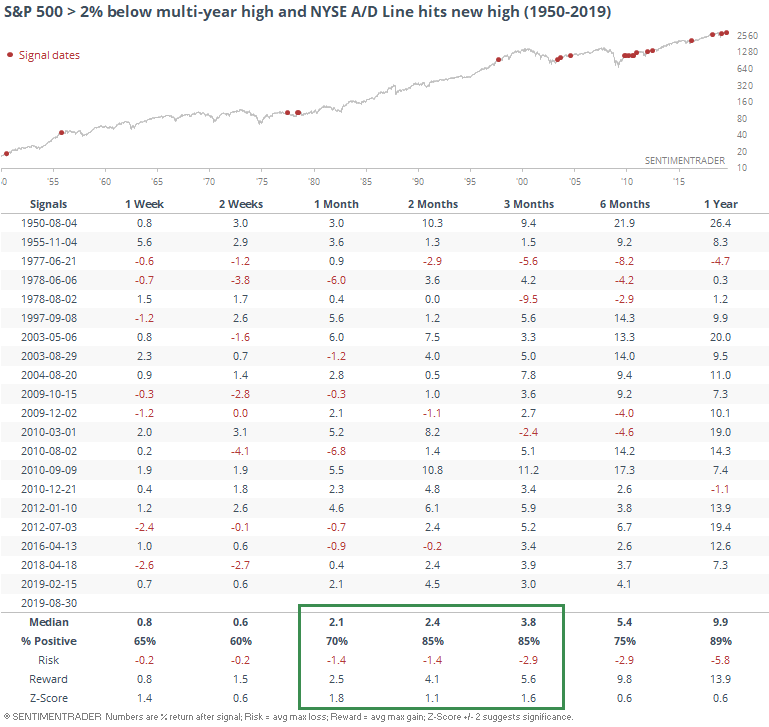
Over the next 2-3 months, the S&P rarely saw a negative return, with no losses larger than -3% two months later.
If the S&P was more than 2% below its high but within 5%, there was a single large loss three months later, but other than that, nada.
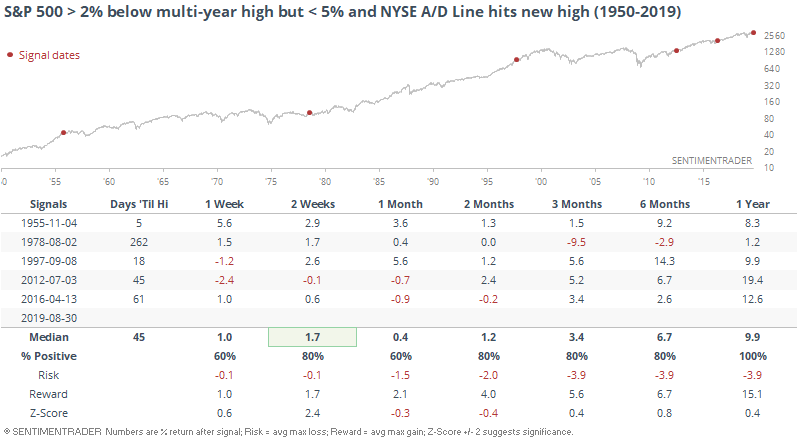
Except for in 1978, the S&P notched a fresh multi-year high within a few months.
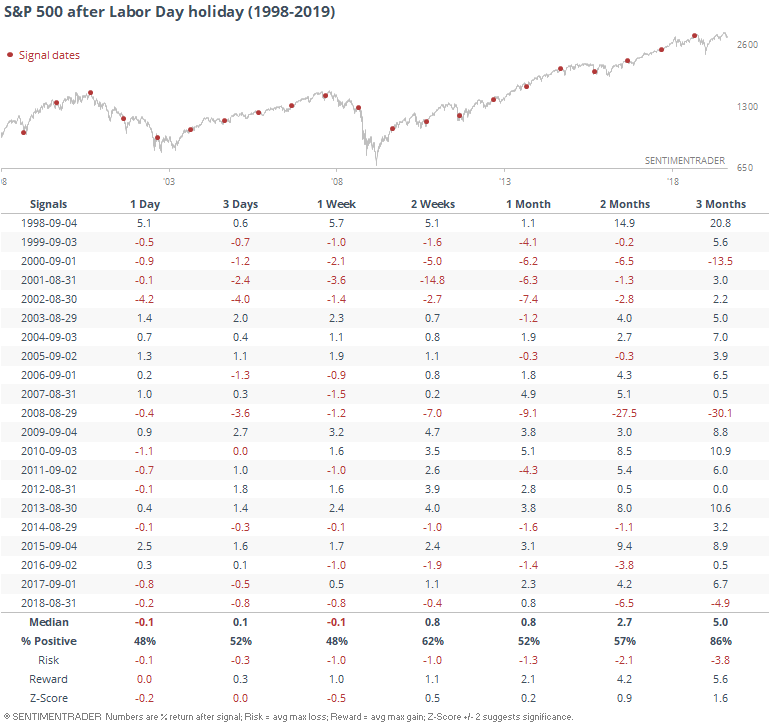
For those curious about such things, seasonality shouldn't impact the figures too much. While stocks have struggled a little bit in the very short-term following the Labor Day holiday, it usually wasn't much and usually not beyond the first few sessions.
Confidence Is Ebbing
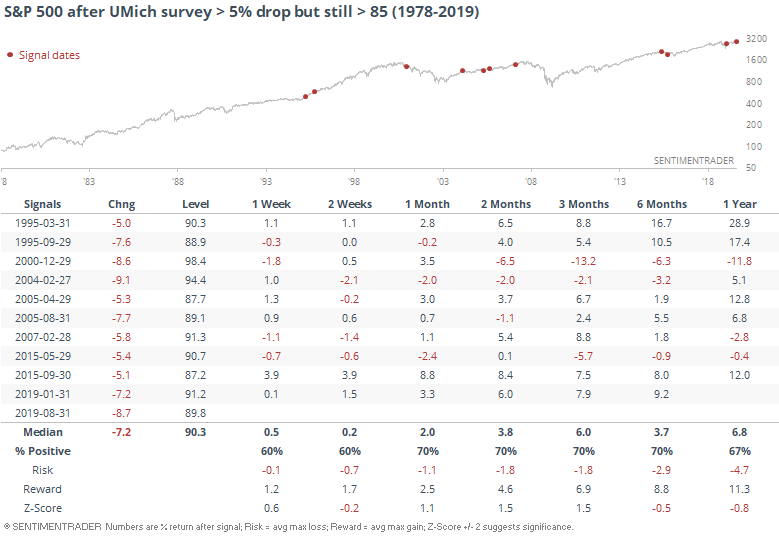
The latest survey of consumer sentiment by the University of Michigan showed the largest monthly decline in years, raising fears that confidence is rolling over from what had been a very high level.
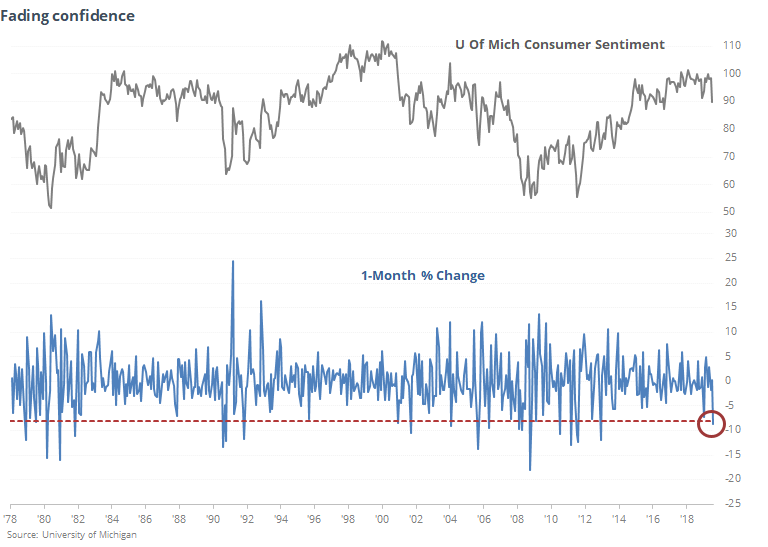
Big drops in the survey from a high level have not consistently been a negative for stocks, though. The S&P 500's returns over the next few months were well above random, though there was one large loss in 2000.
Looked at another way, the survey just hit a 2-year low but is still at a high level.
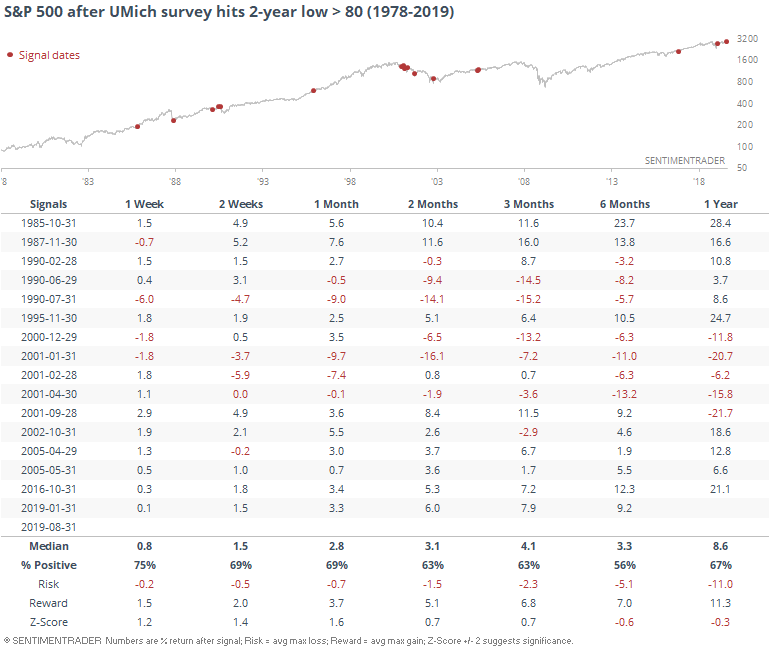
That was a bad sign in 1990 and 2001 ahead of recessions, but otherwise was more of a lagging sign for stocks than leading one.
Sectors And Indexes
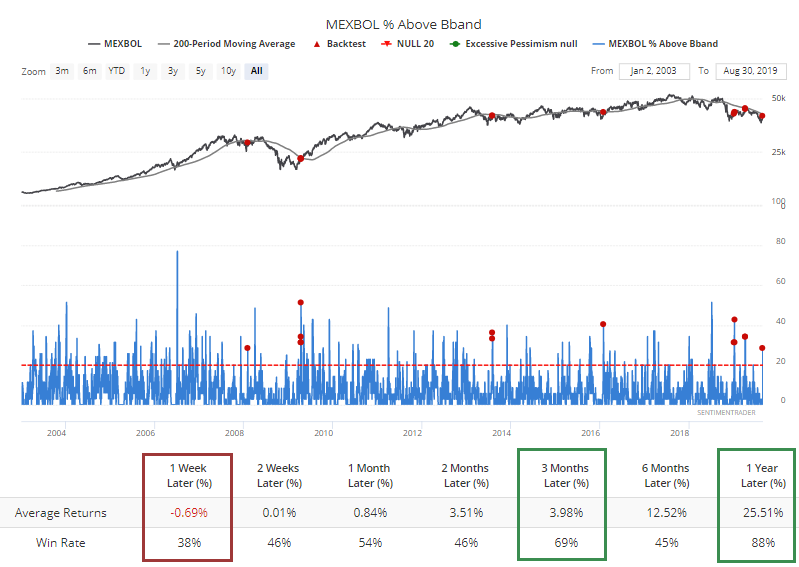
In late July, we were looking for a final plunge in the Mexican Mexbol index to trigger a sustainable rebound. Many of the breadth metrics underlying that index were nearing the levels seen within days of prior major lows. The index subsequently fell further and generated more extremes, and has now showed signs of a thrust to the upside.
The McClellan Oscillator has jumped above 100, which has coincided with other breadth thrusts. The Mexbol has typically traded lower in the shorter-term after thrusts like this, then higher.
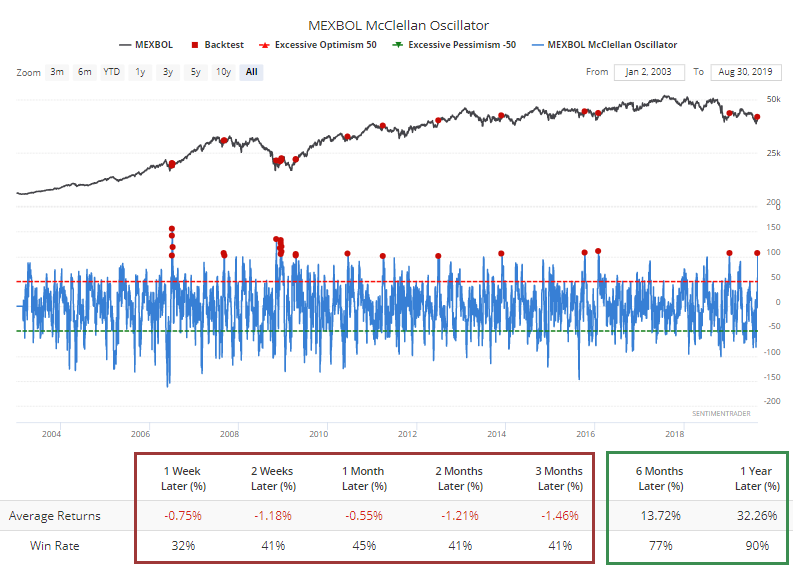
If it was below its 200-day average at the time, it was basically the same pattern, but its one-year return averaged more than 43%.
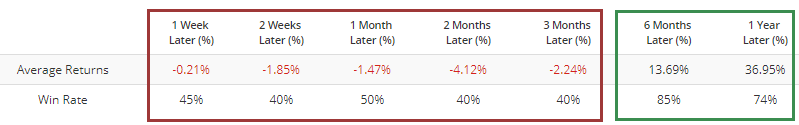
For the EWW fund, it also saw short- to medium-term losses after big spikes in the Oscillator, but enjoyed an average return of more than 13.6% six months later with only a few losses (though one of those, in 2011, was very large).
Another good way to see the thrusty nature of its rebound is that nearly 30% of stocks in the index have popped above their upper Bollinger Bands. When the Mexbol was trading below its 200-day average at the time, it took short-term breathers but generally rose over the medium- to long-term.
Among U.S. indexes, the McClellan Oscillator for the Dow Industrials has cycled from below -100 to above +70, like it did in January and June.
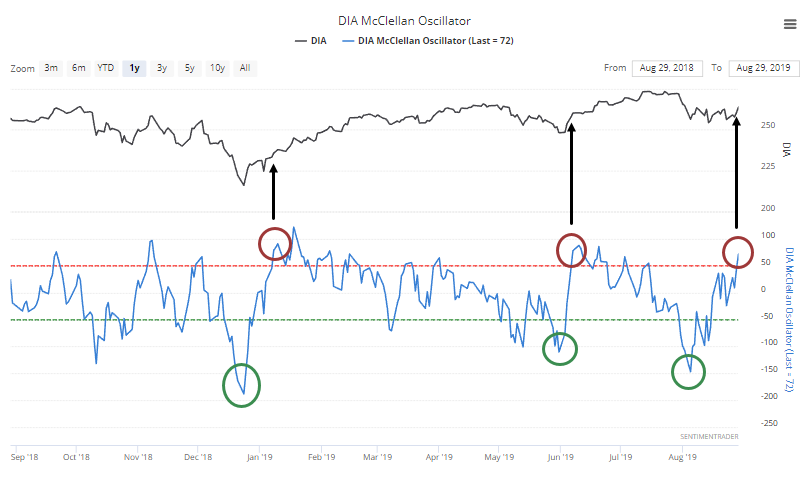
That has generally been a good sign.
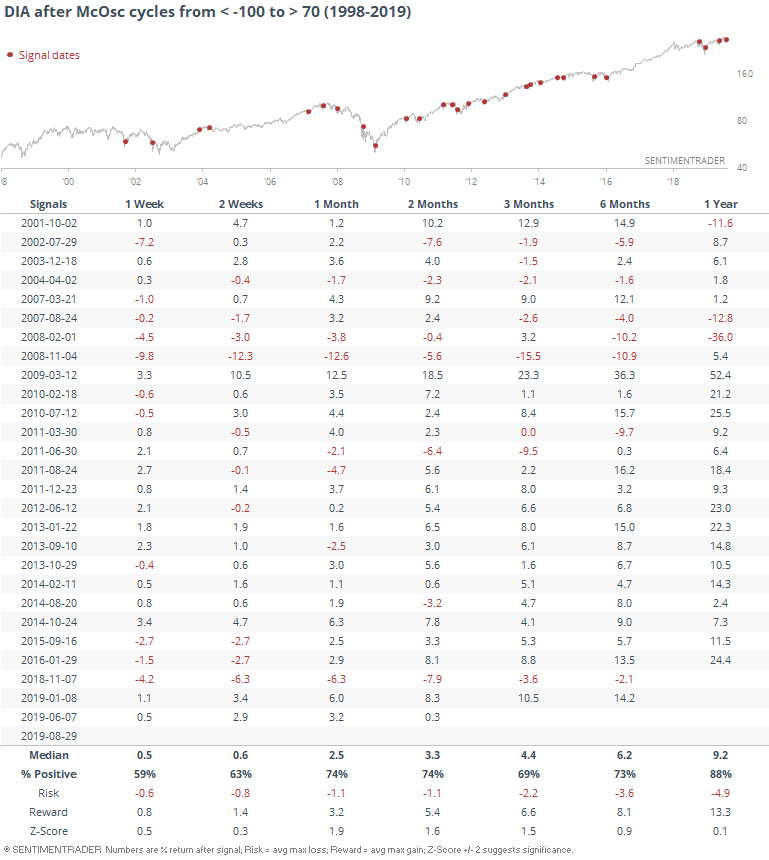
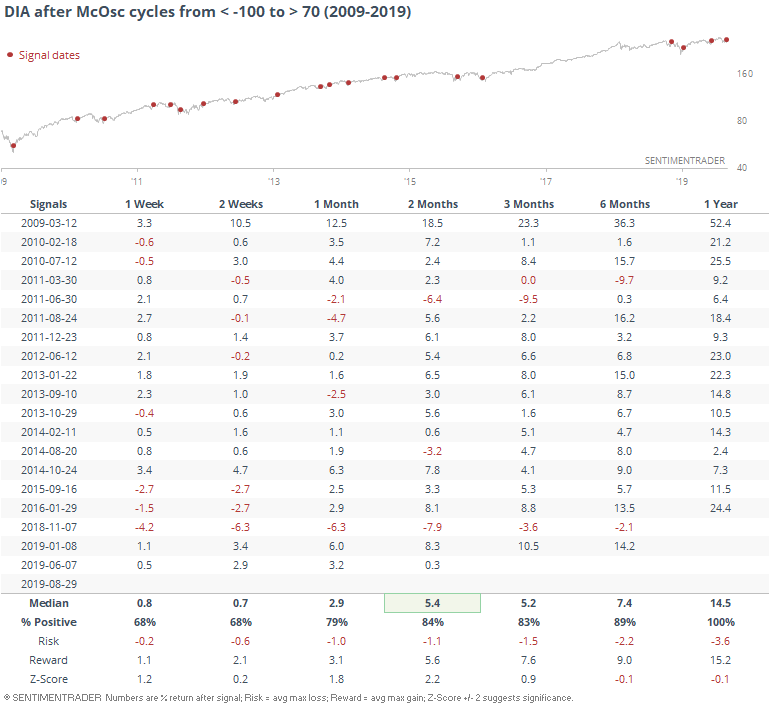
It's been especially good since the end of the financial crisis, which isn't a big surprise given the trend.
A similar cycle in the Oscillator has triggered in the Nasdaq 100 fund, QQQ.
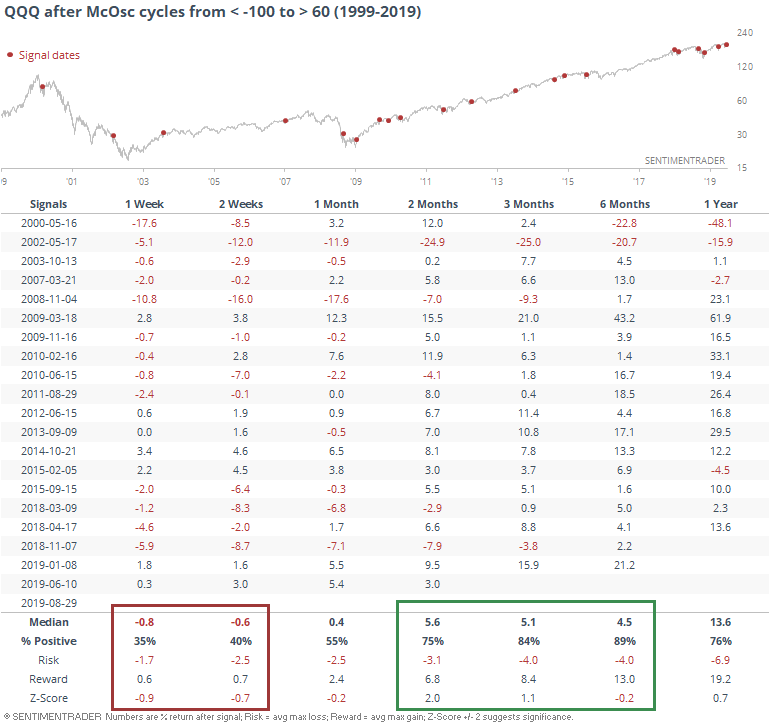
This has been less positive for the big tech stocks in the very short-term, but was excellent over the medium-term, especially if we're naughty and ignore the years immediately following the popping of the internet bubble.
Pain Trade
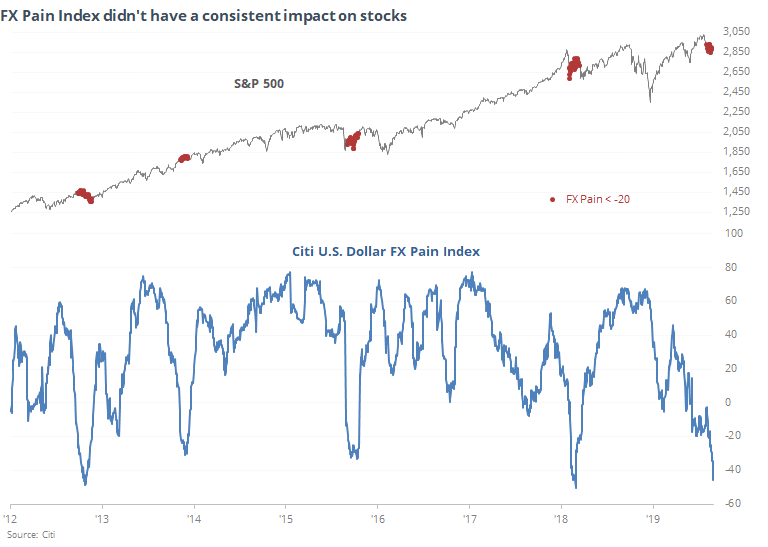
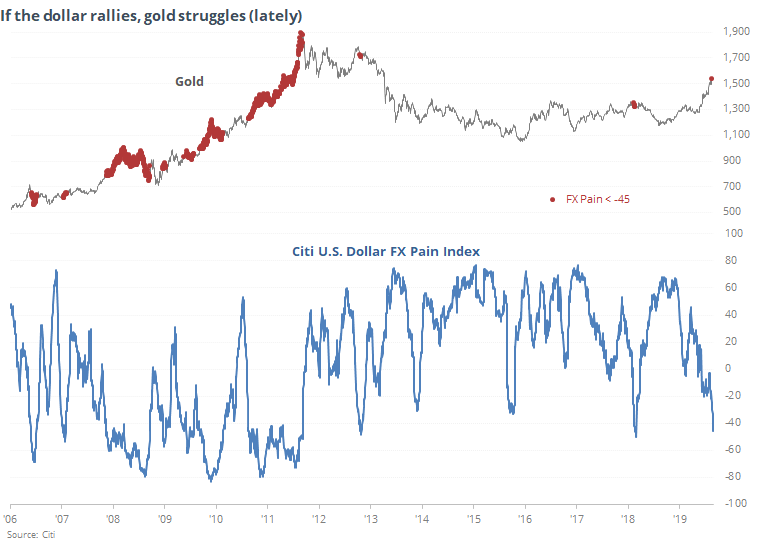
According to an index of active trader positioning, the rally in the U.S. dollar has taken a lot of folks by surprise, and it's becoming very painful. Per Bloomberg:
"The Citi FX Positioning Alert Indicators infer positioning of active currency traders from relationships between exchange rates and currency managers' returns. A positive reading suggests that currency traders have been net long the currency and a negative reading suggests that currency traders have been net short the currency."
The Pain Index for the buck has just reached one of its most extreme levels in 7 years.
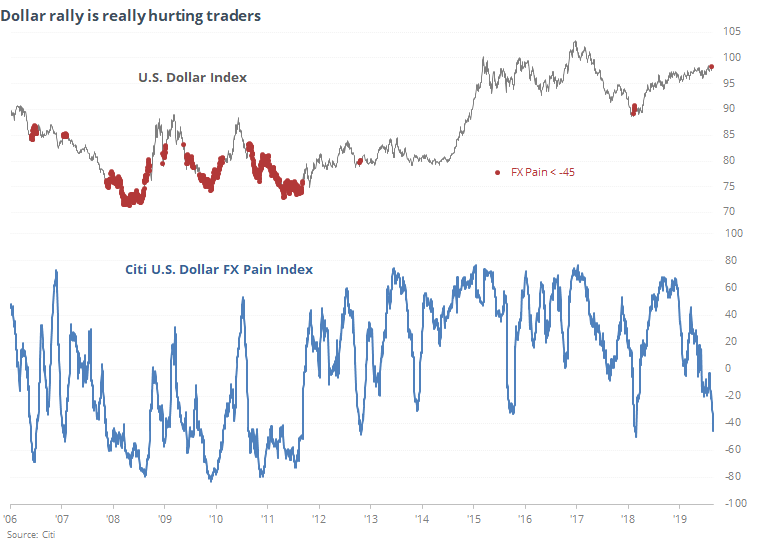
Prior to 2012, the index got much lower as the dollar declined, so it wasn't nearly as effective as it has been since then.
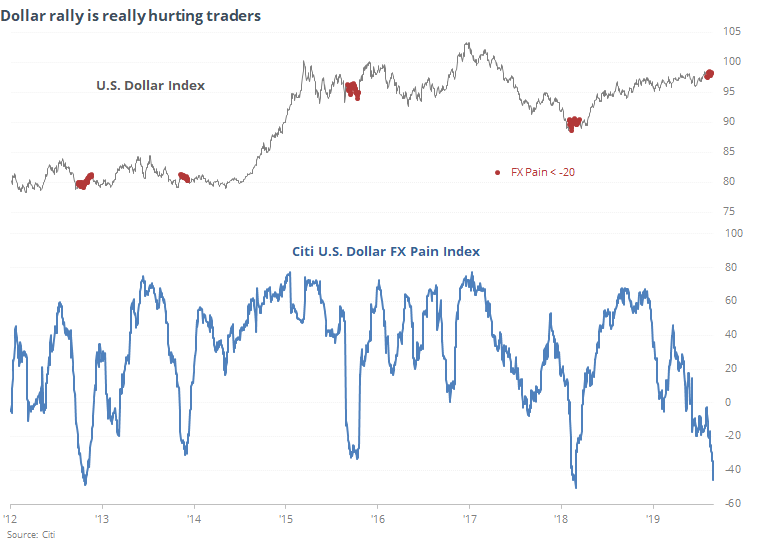
If we focus on these last 7 years, we can see that even lesser extremes of -20 in the Pain Index have preceded strong rallies.
If the Pain Index is an accurate reflection of poor positioning that's on the cusp of reversing and triggering an even higher dollar, that has preceded some tough times for gold lately.
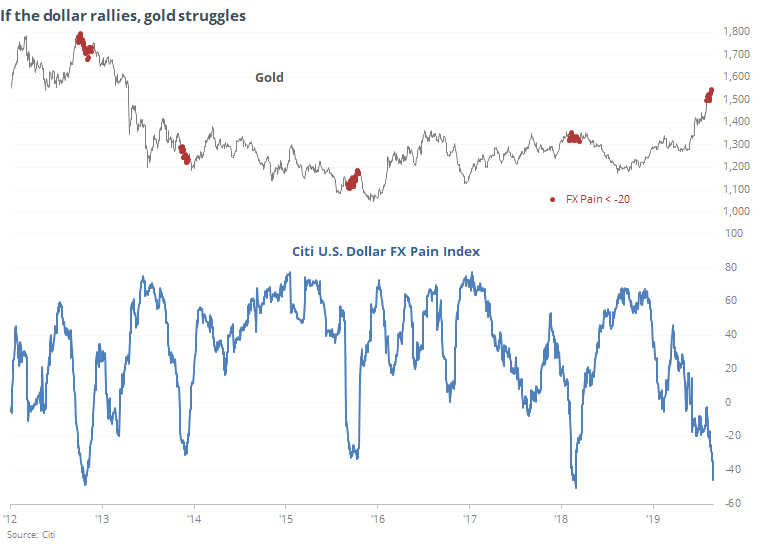
But again, that's only for the past 7 or so years. Prior to 2012, gold was able to keep rallying even when the Pain Index was at a true extreme.
There is something of a worry that although gold has done an okay job of following its historical seasonal pattern this year, its rise in August has "pulled forward" what has often been a good September for the metal.
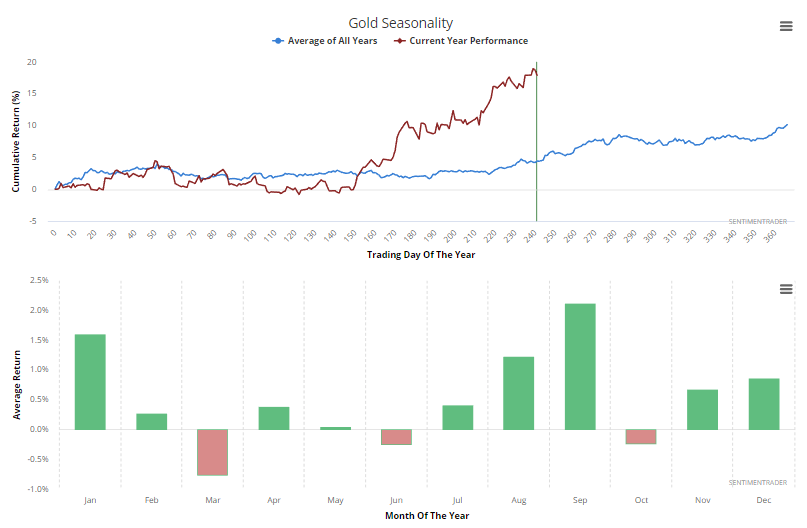
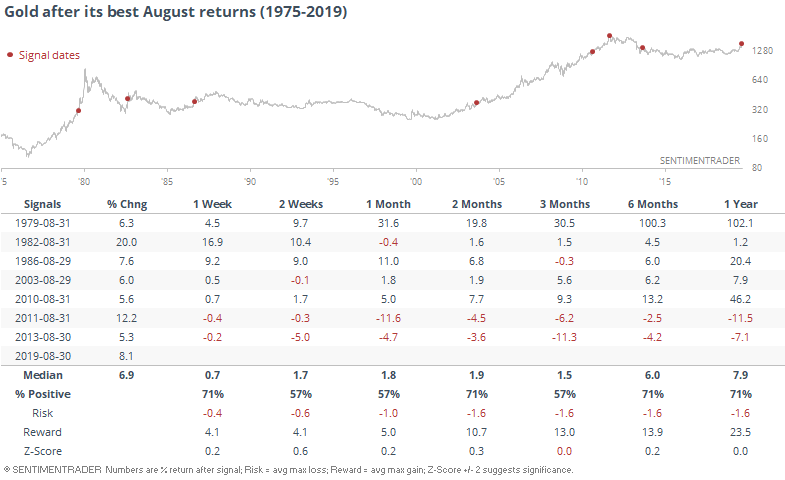
That has been a tough argument historically, as its best Augusts have typically led to even more gains. The biggest worry is that the last two both occurred as gold peaked.
As for stock investors, the FX Pain being so low did not lead to consistent returns.
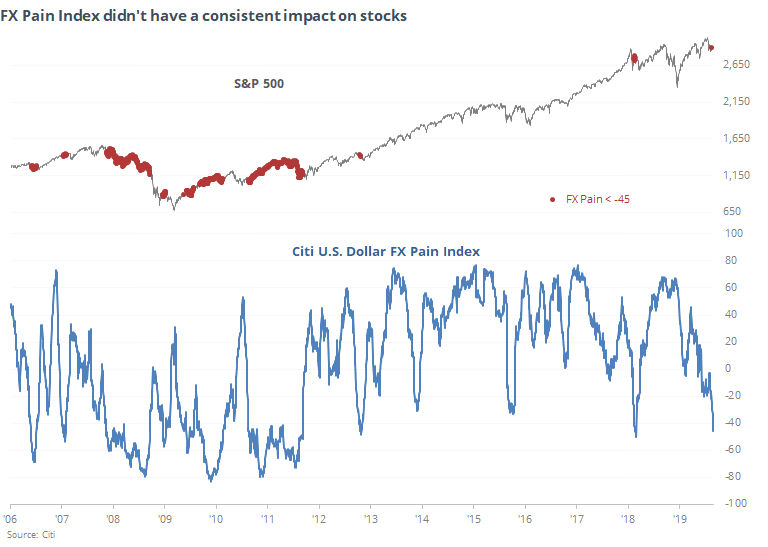
Lesser extremes in recent years have mostly led to a higher stock market in the months ahead, but that's not saying a whole lot given the strong trend.