Friday Color - Bond Flow (!), Recession Risk, Breadth Thrust, Gold Options, Stock Screen

Here's what's piquing my interest so far on a choppy Friday.
Bond Flow
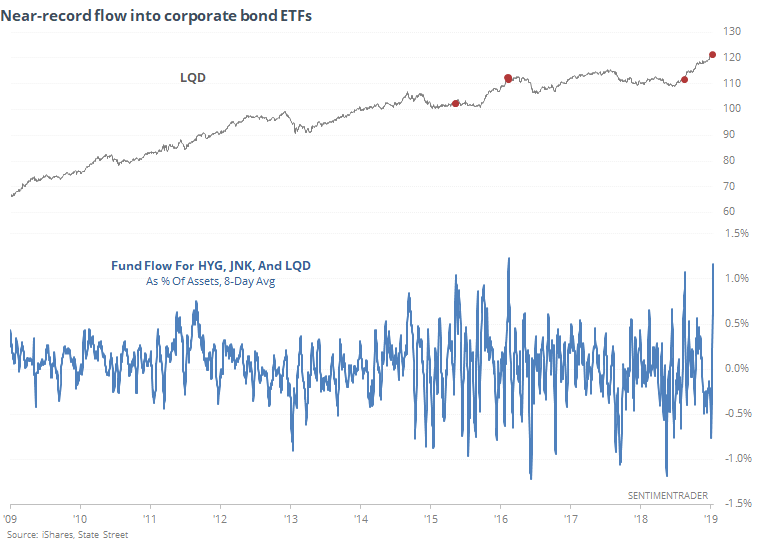
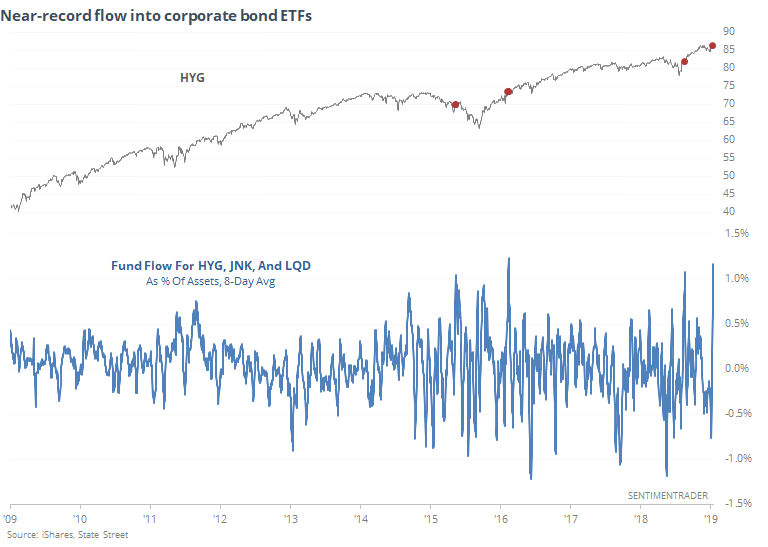
Over the past 8 sessions, corporate bond ETFs LQD, HYG, and JNK have seen steady inflows. To a near-record degree, in fact. That happened in the midst of a nice run in January of this year, with no ill effect. But it also happened prior to a tough couple of months for the funds in 2015 and '16.
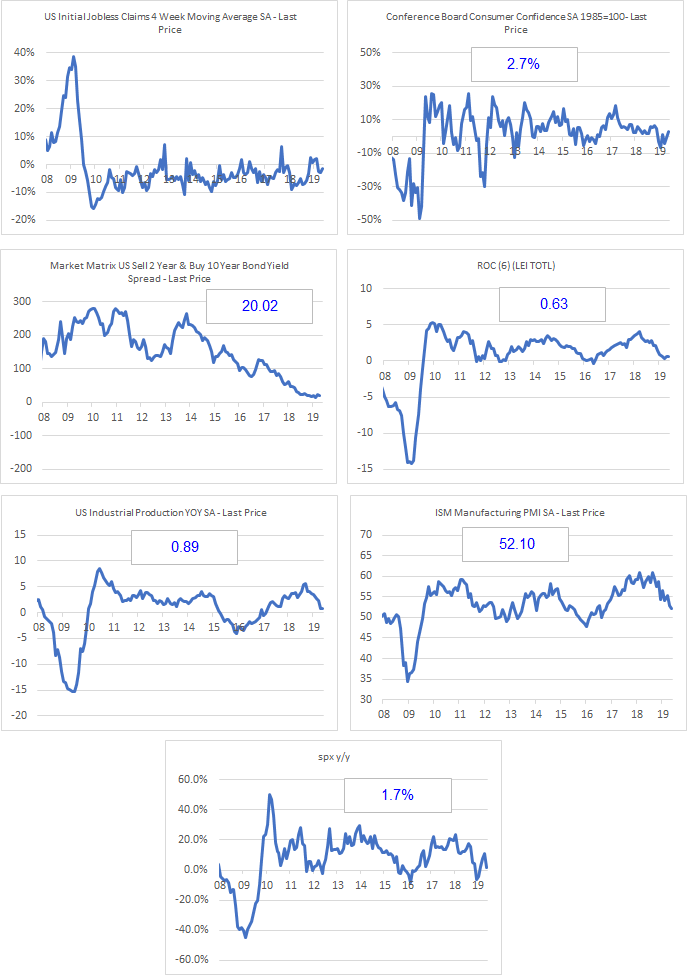
Recession Model
Some recession models continue to show a relatively high, and increasing, probability of recession within the next 6 months. Most of these are heavily influenced by the yield curve.
If we update the simple one we looked at months ago, it has actually decreased from a 40% probability at the end of last year to 0% now. Over the past 50 years, when the model was 25% or below, the S&P 500 returned an annualized 9.6%. When it was 75% or above, it returned 3.7%.
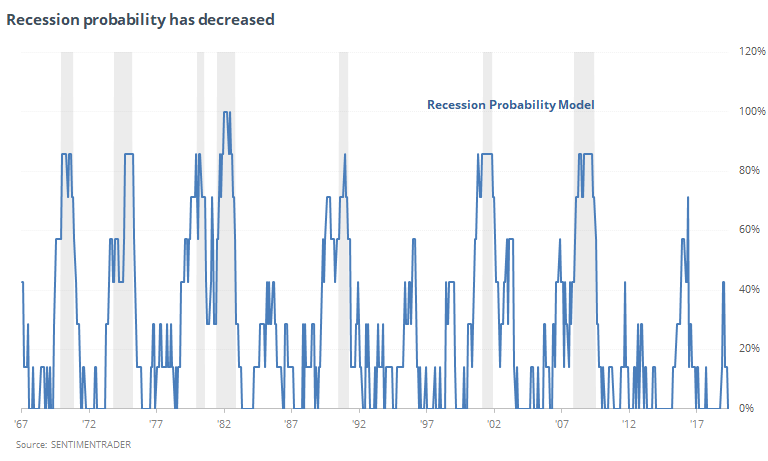
Most of the components are weak, but outside of the normal window that would indicate recession.
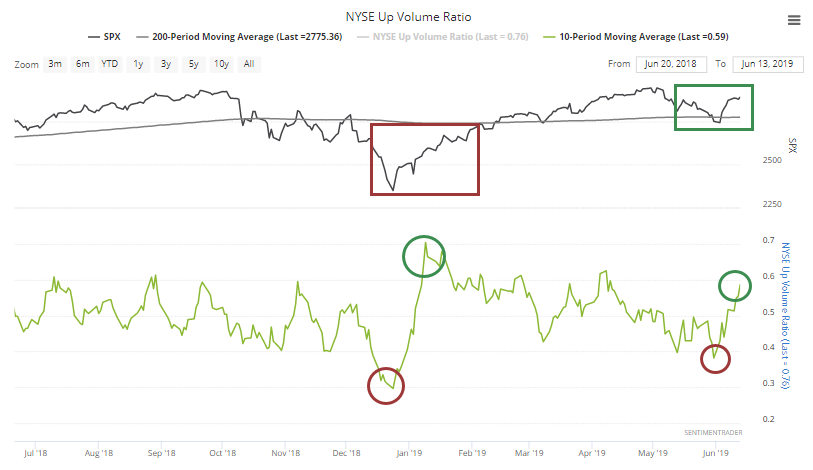
Volume Thrust
For the first time in months, the 10-day average of Up Volume, using either a simple or exponential average, is rising toward 60%. This comes on the heels of a sub-40% reading, nearly qualifying us again for a Zweig Breadth Thrust. It's not quite there, but close.
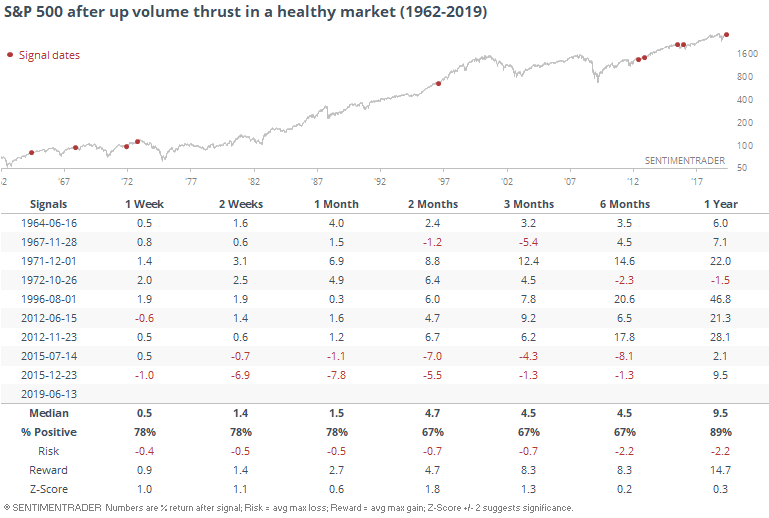
When this triggered in January, the S&P 500 was still mired below its 200-day average and well off its high. Now, it's occurring in a much healthier market.
Usually, this meant even more buying pressure, with relatively limited risk.
Gold Buyers
Bloomberg noted that the risk reversal for gold has hit a 3-year high. A risk reversal is an options strategy involving selling a put option and buying a call. The higher the price of the strategy, the more traders are (seemingly) betting on the upside.
Looking at 1-month options, the risk reversal for gold is nearing the highest level in a decade.
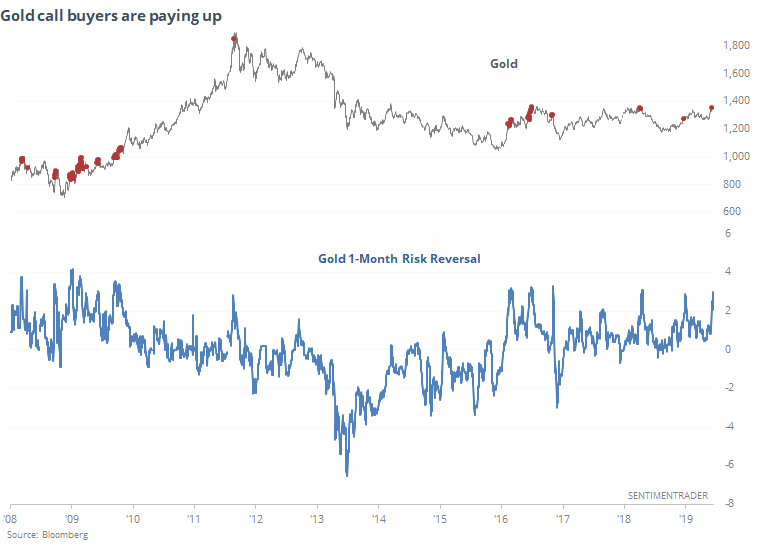
When it's gotten this high in the past 5 years, gold hasn't been able to maintain its gains. But it's been in a bear market environment for all practical purposes, and when we look at similar levels of enthusiasm from 2008-09, it didn't necessary have the same implications. At least not in the latter part of '09 when it continued to climb unabated even though traders were favoring calls.
Looks like a minor warning sign here. Like everything, if gold can continue to climb in the face of signs like this, it suggests something is different from the past half decade.
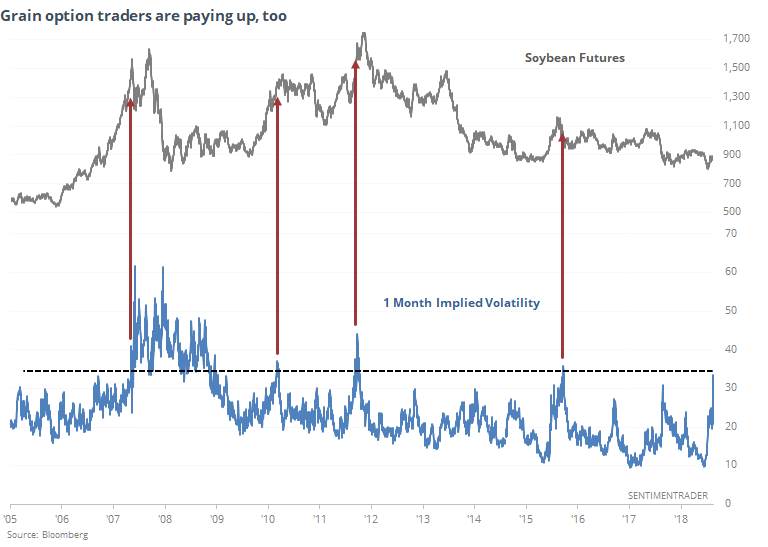
Grain traders are in the same boat. They've been ramping up the implied volatility of options in contracts like soybeans, which has happened at other blow-off peaks over the past decade.
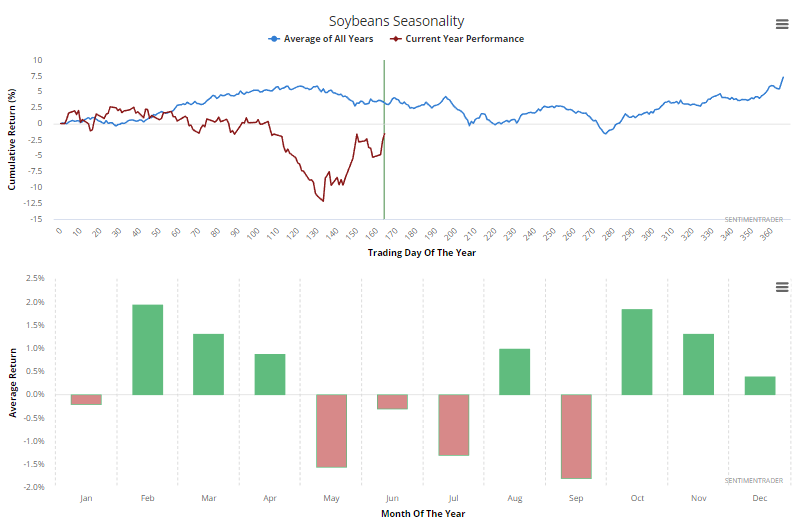
The usual caveats about seasonality apply, but it's been historically tough for the grain to sustain momentum during the summer months.
Stock Screen
The long and short stock screens usually show some interesting setups. It's useful to use the Backtest Engine to test the setups, because it often highlights peculiar action depending on the stock or sector.
One of the notable aspects of the screens right now is that the short screen is showing quite a few normally staid stocks. A company will make it onto the list if it's been showing high optimism in recent days while trading below its 200-day average.
For a stock like Weyerhaeuser, it shows some short-term weakness after readings like this, but not too much after that.
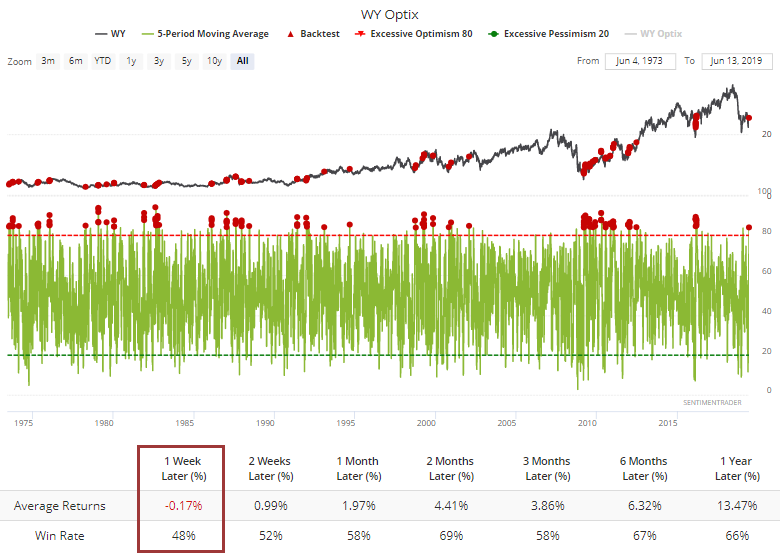
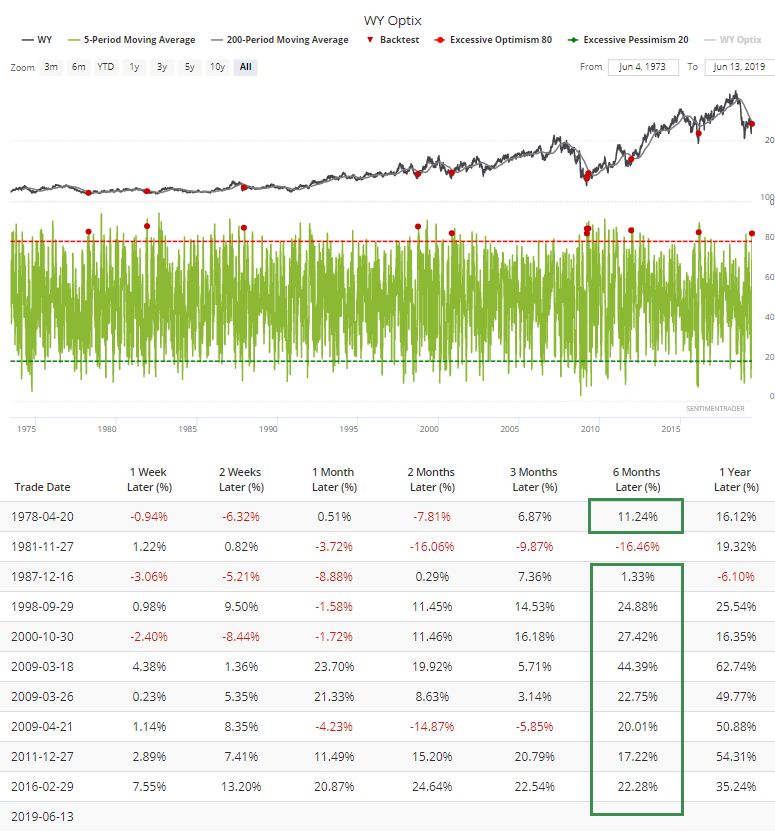
The interesting thing, though, is that this kind of sentiment normally triggers when the stock is uptrending. When it has triggered and WY was below its 200-day average, it has typically come during the initial burst of buying interest following a long decline, leading to substantial gains over the medium- to long-term. The only exception was in 1981.
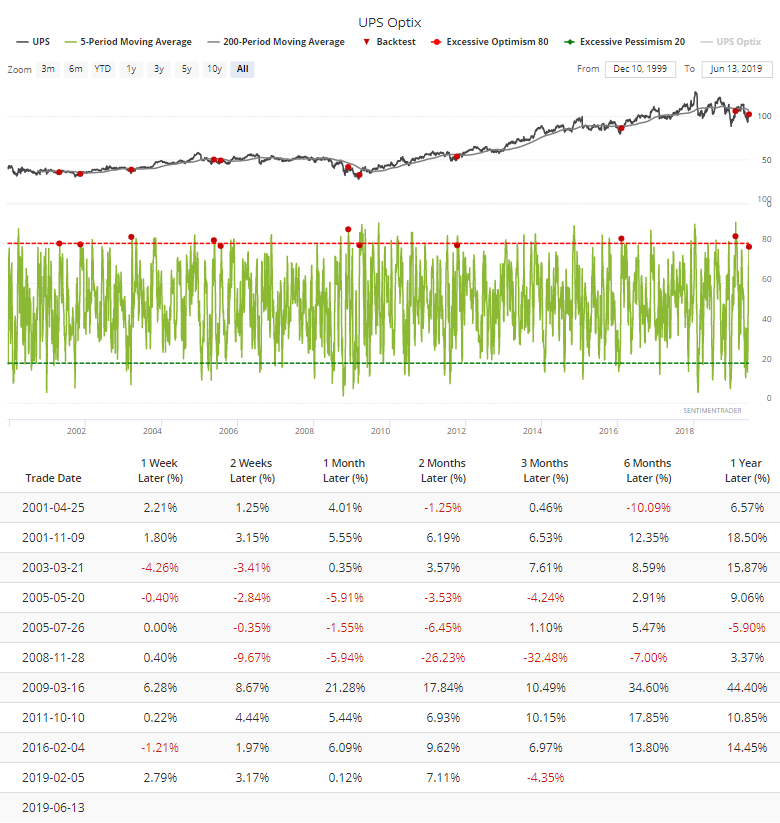
United Parcel Service has had some sketchy returns with optimism this high, as well.
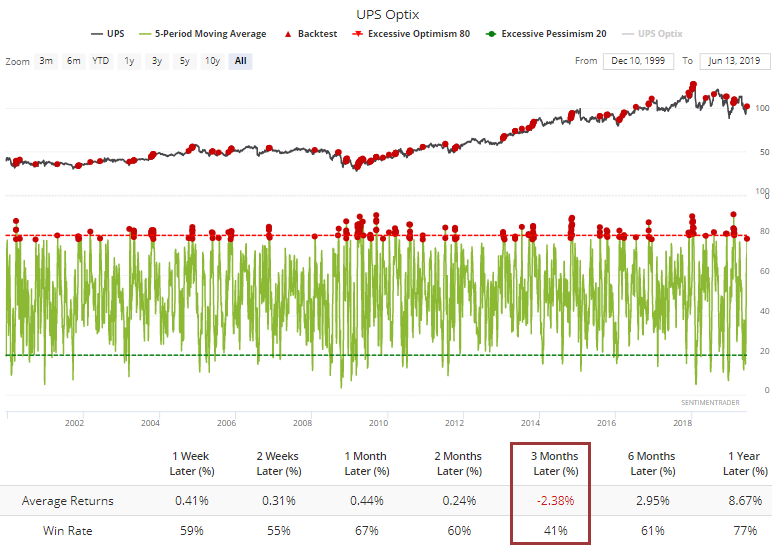
But like WY, when it has triggered during a downtrend, it has often indicated a change in buying intensity that has preceded good longer-term gains.