
Four reasons not to give up on tech just yet

Key Points
- Price action remains in an uptrend
- The long-term breadth for the tech sector remains in an uptrend
- The correlation among stocks in the sector is closer to bullish levels than bearish levels
- Tech corporate insiders remain very heavy buyers
Price action
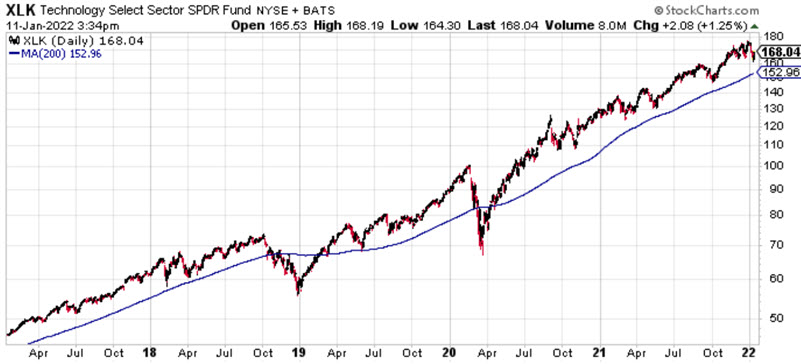
The most rudimentary analysis we can do is comparing the Technology Select Sector SPDR ETF (XLK) price to its 200-day moving average. Objectively, if the price is above the 200-day average, the price is in an uptrend and vice versa.
The chart below (courtesy of www.StockCharts.com) displays five years of price action for XLK along with the 200-day moving average. One can argue that this action cannot last forever, and there is no way to know when the actual top will come. However, while the price remains above the 200-day average, there is also no objective way to designate the action as "bearish."
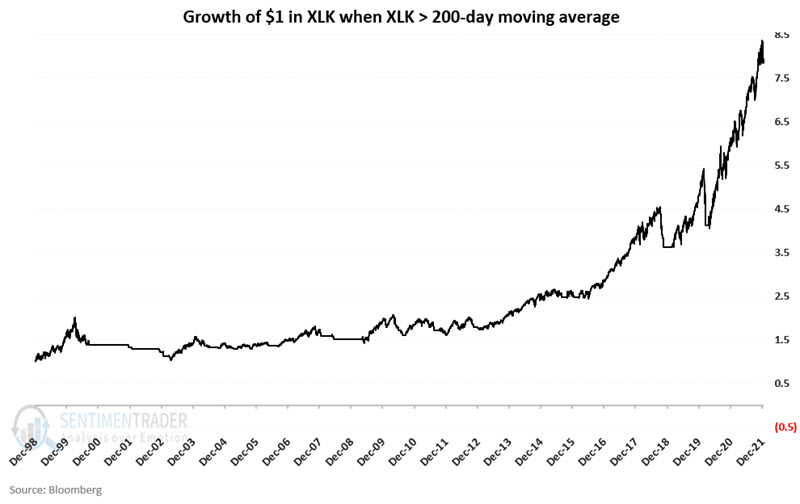
The chart below shows the growth of $1 invested in XLK only when it exceeds its 200-day moving average.
The chart below shows the growth of $1 invested in XLK only when it is below its 200-day moving average.
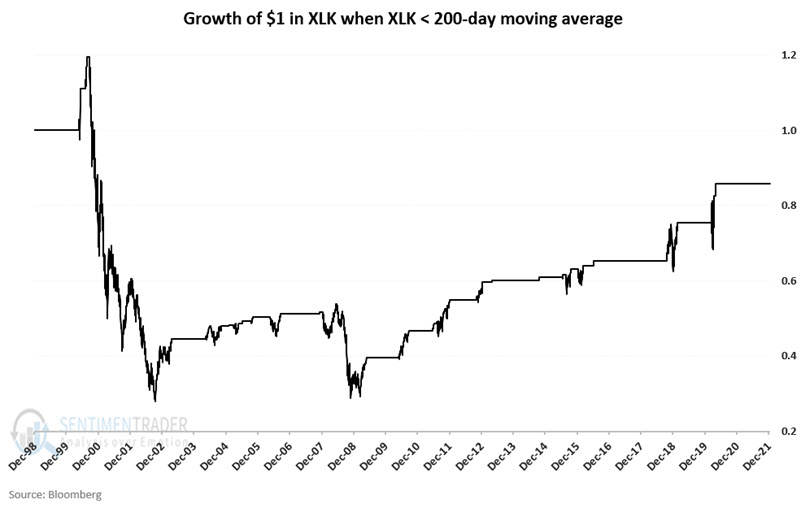
Clearly, the bulk of bear markets tends to play out when the price is below the 200-day moving average.
XLK cumulative advance/decline line
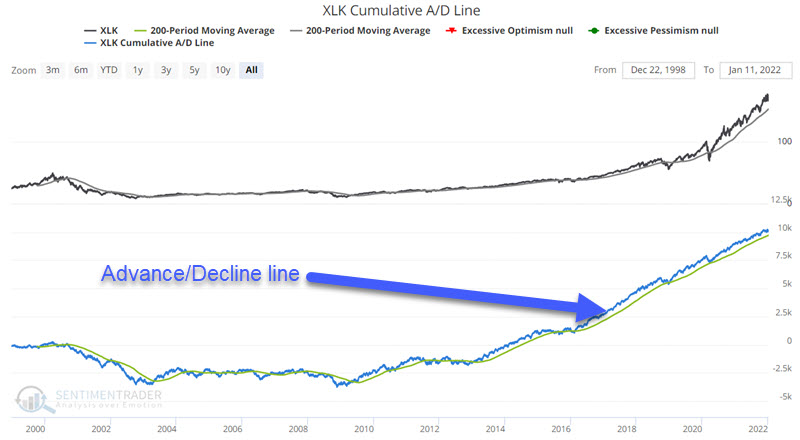
The XLK cumulative advance/decline line takes the daily net number of advancing minus declining issues for the XLK index and adds it to the previous day's total (or subtracts if there were more declining than advancing stocks). This data series is often used to spot divergences between market breadth and the underlying index. However, we will use this data series as another trend-following indicator in this instance.
The most rudimentary analysis we can do is compare the XLK advance/decline line to its 200-day moving average. Objectively, if the advance/decline line is above its 200-day average, it is in an uptrend and vice versa.
The chart below XLK price action (along with the 200-day moving average) is on top with the cumulative XLK advance/decline line (along with its 200-day moving average) on the bottom.
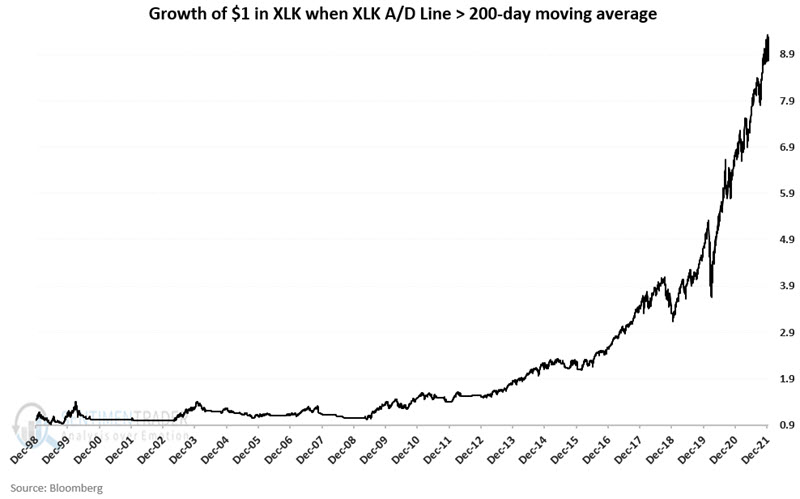
The chart below shows the growth of $1 invested in XLK only when the XLK cumulative advance/decline line is above its 200-day moving average.
The chart below shows the growth of $1 invested in XLK only when the XLK cumulative advance/decline line is below its 200-day moving average.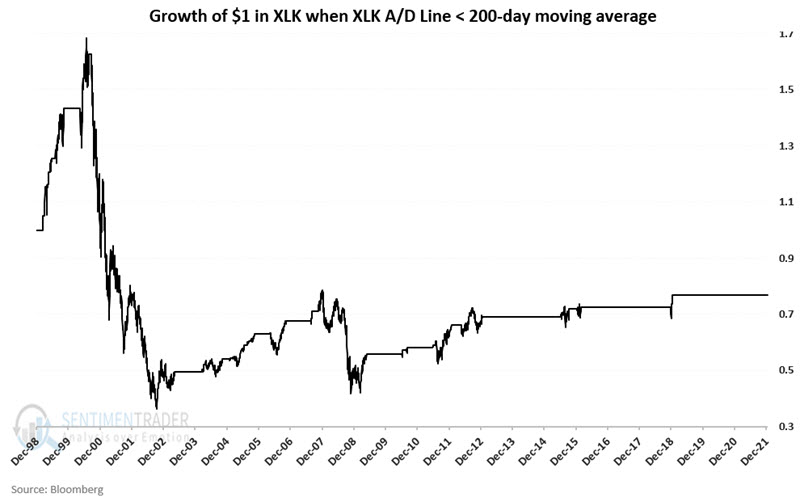
These charts are of no use in identifying turning points. Nevertheless, the fact remains that most of the gains and then some are made when the A/D line is trending higher.
Combining price and breadth
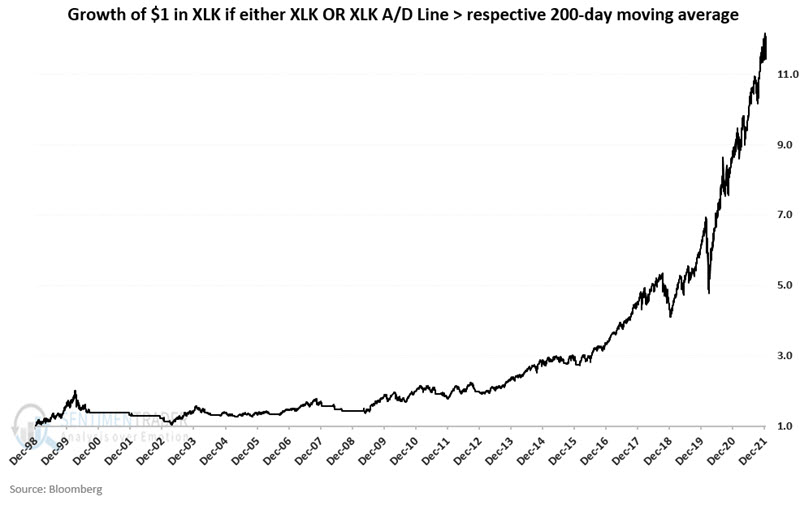
Now let's put price and breadth together. The chart below displays the growth of $1 invested in XLK when either price or the advance/decline line for XLK are above their respective 200-day moving average.
The chart below displays the growth of $1 when BOTH the price of XLK AND the advance/decline line are below their respective 200-day moving average.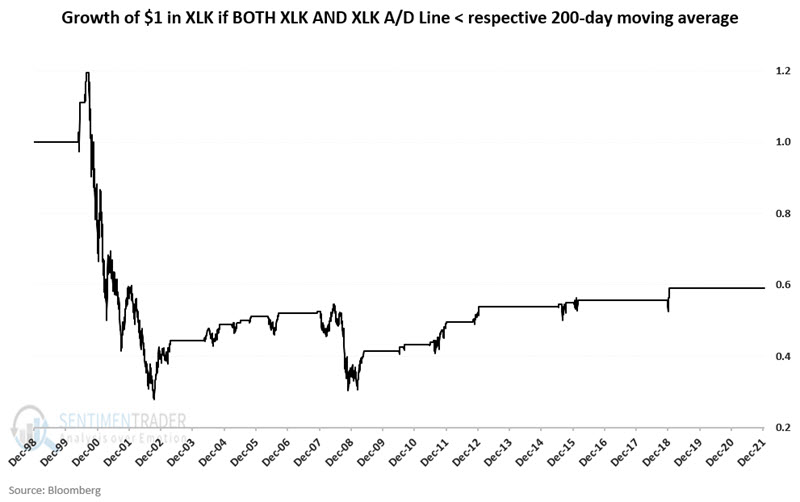
From December 1998 into January 2021:
- $1 invested when either component is positive grew to $11.42 (+1,042%)
- $1 invested when both components are negative shrank to $0.59 (-41%)
Clearly, the "trend is your friend" regarding technology stocks.
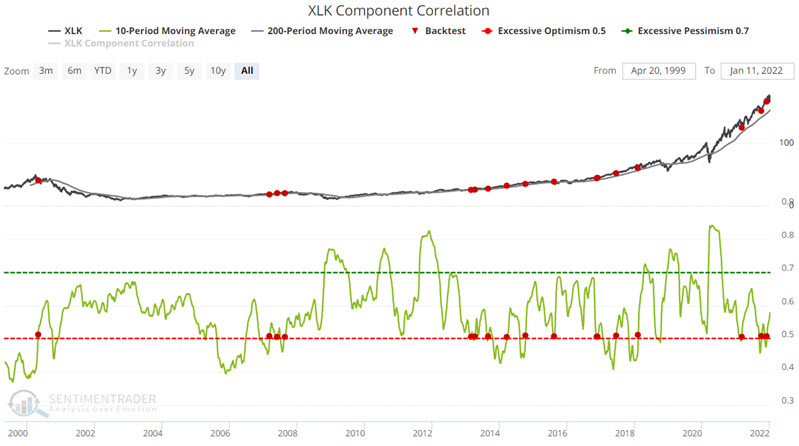
XLK Component Correlation
This indicator shows the correlation among members of the sector. During times of panic, investors tend to buy or sell "everything" together, no matter their individual merits, so correlation rises. The higher it goes, the more we're seeing group-think, which tends to happen at times of extreme pessimism, and is thus usually a positive for stocks in the future. When conditions are calm, and investors become complacent, they trade stocks on their own merits, and correlation drops. That tends to lead to below-average returns for the sector going forward.
You can run the following test in the Backtest Engine. This test identifies those times when the 10-day average crosses above 0.50 while XLK is above its 200-day moving average.
The chart below displays the signals from this test.
The table below displays a summary of XLK performance results following previous signals.
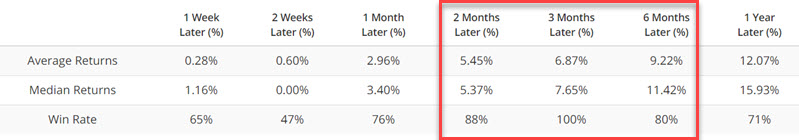
XLK has shown a gain three months after each previous signal. The most recent signal occurred on 12/6/2021.
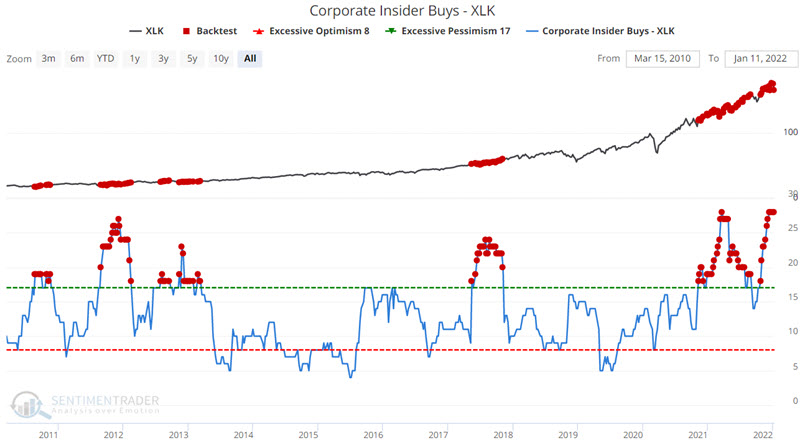
Corporate Insider Buys - XLK
It is rather astounding that despite the long, massive rally in technology stocks, technology company corporate insiders continue to be very aggressive buyers of their own stock. While insiders are by no means infallible, the fact remains that when they act aggressively in concert, historically, they have rarely been dead wrong.
The implication is that despite all of the hand-wringing surrounding the tech sector at the moment, the people who presumably know the most about the company's prospects remain aggressively bullish.
You can run the following test in the Backtest Engine.
The chart below displays periods of heavy insider buying among the companies whose stocks comprise XLK.
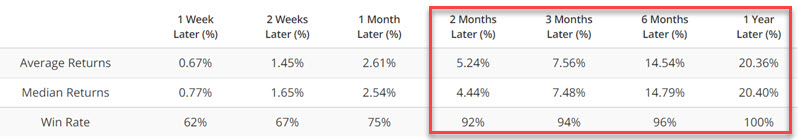
 The table below displays a summary of XLK performance results following previous signals.
What the research tells us…
Price action for XLK - and for the stocks that comprise the index - remains constructive. Advance/decline data for XLK stocks also remains in a bullish uptrend, and buying among corporate insiders for the same companies remains exceptionally strong.
None of these factors guarantee that tech stocks cannot or will not run out of steam, But the uniform bullishness of these factors does argue in favor of ignoring a lot of the worrisome noise engulfing the tech sector of late. Investors may be wise to give the bullish case the benefit of the doubt until the indicators suggest otherwise.